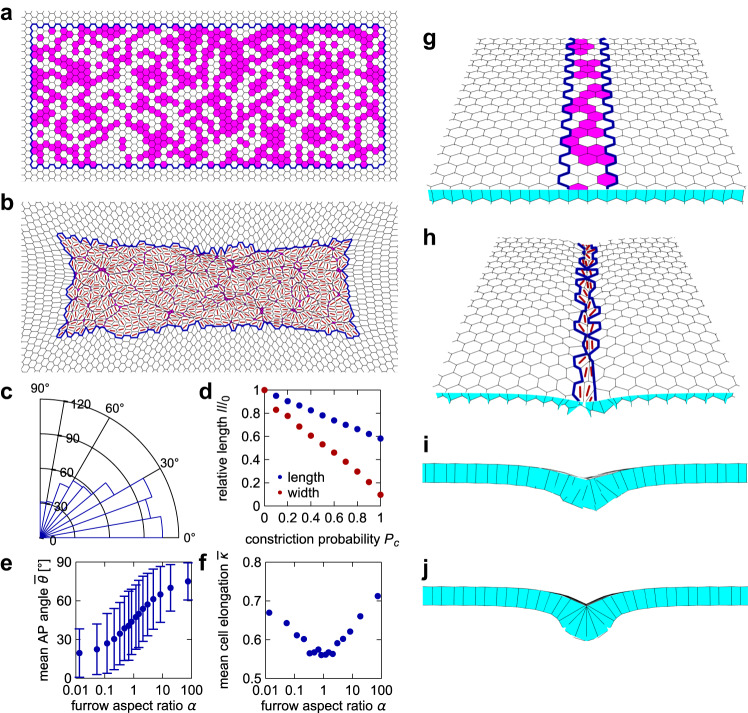
Fig. 3. Mechanical model shows that contractile cell subpopulation leads to cell elongation and alignment.
a–f 2D vertex model of the neural plate. a Zoom on the neural plate region of the vertex model initial condition. Blue border outlines the posterior neural plate region of the model tissue. Apically constricting cells are in magenta (tissue shown for ). b Model tissue from (a) after relaxation at . Red lines show the direction of cell elongation. c Distribution of angles between the AP axis (horizontal line) and cell elongation direction of non-constricting neural plate cells for the model posterior neural plate in (b); 0° corresponds to perfect alignment. d Central length (along AP) and width (perpendicular to AP) of the model tissue after relaxation as a function of the probability of cell constriction ; values are normalized by length and width if no cells constrict. e Mean angle with the AP axis as a function of the constricting region aspect ratio . Error bars indicate the standard deviation between all non-constricting cells in one instance of the model tissue for each (number of cells in order of increasing ). f Mean cell elongation as a function of the furrow aspect ratio. See Methods for details. e and f are for . g–j Furrow formation in a 3D vertex model simulation of the hinge area. g Initial condition for the 3D vertex model simulation. Hinge region is outlined by a blue border and constricting cells are shown in magenta (tissue shown for ). h Model tissue from (g) after relaxation at time . Red lines show the direction of elongation for the apical side of the cells. i Cross-section view of the model tissue in (h), showing the formation of a shallow furrow. j Cross-section view of a model tissue with .

