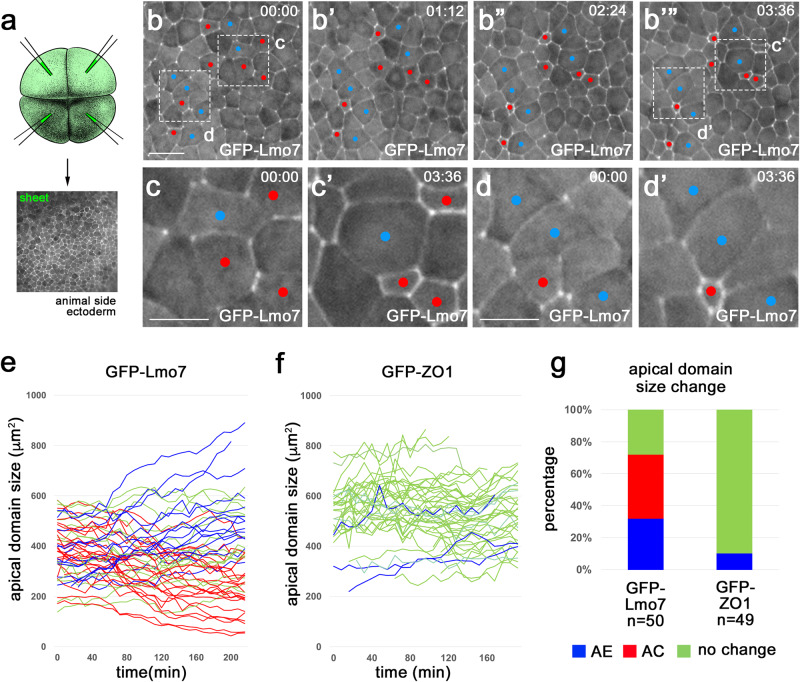
Fig. 5. Apical domain heterogeneity in ectoderm cells expressing Lmo7.
a Scheme of the experiment. GFP-Lmo7 (100 pg) or GFP-ZO1 RNA (150 pg) was injected into four animal blastomeres of 4–8-cell embryos for live imaging at stage 11. Uniform fluorescence has been confirmed in stage 11 ectoderm. Adapted from Xenopus illustrations © Natalya Zahn (2022), Xenbase (www.xenbase.org RRID:SCR_003280)75. b-d’ Time-lapse imaging of GFP-Lmo7 embryos for ~4 h. Apically constricting (AC) and expanding (AE) cells are marked by red and blue, respectively. Areas in (b) and (b’”) are enlarged in (c, d) and (c’, d’), respectively. Quantification of apical domain dynamics in GFP-Lmo7 (e) and GFP-ZO1 (f) cells in one representative embryo. Each line represents apical domain size changes of individual cells for ~4 h. The cells were scored as AC (red) or AE (blue) if they had more than 20% decrease or increase in their apical domain size, respectively. The remaining cells were designated as ‘no change’ (green). n = 50 cells for GFP-Lmo7. n = 49 cells for GFP-ZO1. g Frequencies of cells with different changes in apical domain size are shown for embryos in (e) and (f). The Freeman-Halton extension of Fisher’s exact test. Two-sided. p = 2.383 E-13. These experiments were repeated 3–5 times. Scale bars are 40 μm in (b) and 20 μm in (c, d).

