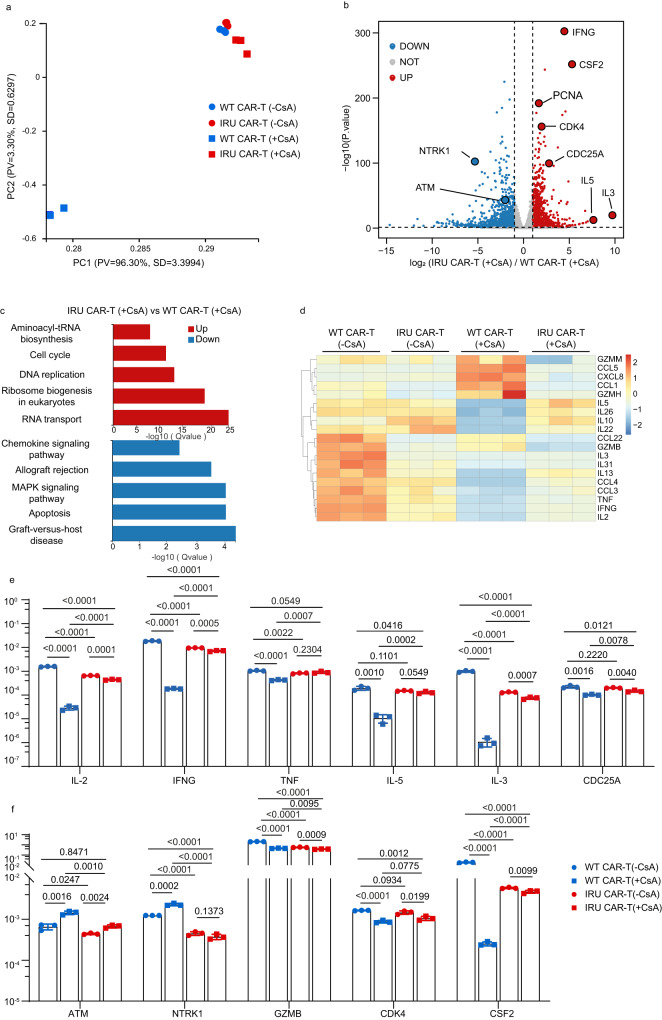
Fig. 2. The transcriptional signatures IRU CAR-T cells in the presence of CsA in vitro.
a–d Bulk RNA Sequencing analysis for four groups (WT/ IRU CAR-T cells (+/- CsA), n=3 technical replicates, 1 donor upon stimulation with 10-fold irradiated (50 Gy) Nalm6-FFluc-GFP). a PCA depicted the clustering of the transcriptome profile of WT/IRU CAR-T cells (+/- CsA). b Volcano plots showed the DEGs in WT/IRU CAR-T (+CsA) groups. c KEGG analysis showed the up- and downregulated gene sets in WT/IRU CAR-T (+CsA) groups. d Heatmap demonstrated the DEGs in cytokine and chemokine among the WT/IRU CAR-T cells with/without CsA. e, f qPCR validation of representative genes in bulk RNA-seq (n = 3 technical replicates, 1 donor. Data from the other two donors can be found in the source data file). All data are means ± s.d. P values were determined by two-tailed Unpaired t test (e, f). WT CAR-T (-CsA) as blue circle, WT CAR-T (+CsA) as blue square, IRU CAR-T (-CsA) as red circle and IRU CAR-T (+CsA) as red square.

