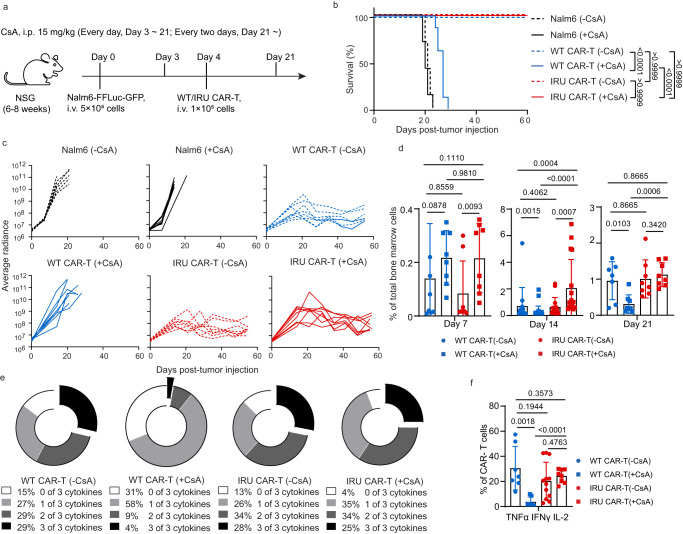
Fig. 3. IRU CAR-T cells retained anti-tumour functions in the presence of CsA in vivo.
a Schematic of NOD.Cg-PrkdcscidIl2rgem1Smoc (NSG) (female, aged 8-12 weeks) model for (b–e). b Kaplan–Meier analysis of the mice survival in each experimental group (n = 8 animals in 2 batches). c Tumour burden (average radiance, ph/s) of mice treated with WT/IRU CAR-T cells (+/- CsA) (n = 8 animals in 2 batches). d Frequencies of CAR-T cells in bone marrow after tumour injection at day 7, 14 and 21 (n = 8 animals in two batches, 14 animals in three batches, and 7 animals in two batches at day 7, 14, and 21 respectively in WT CAR-T (-CsA); n = 8 animals in two batches, 24 animals in four batches and 8 animals in two batches at day 7, 14 and 21 respectively in WT CAR-T (+CsA); n = 8 animals in two batches, 15 animals in three batches and 8 animals in two batches at day 7, 14 and 21 respectively in IRU CAR-T (-CsA); n = 8 animals in two batches, 17 animals in four batches and 8 animals in two batches at day 7, 14 and 21 respectively in IRU CAR-T (+CsA)). e, f Cytokine detection of CAR-T cells in each group at day 14 upon stimulation with PMA/Ionomycin for 4 hrs. Donut (e) and column charts (f) indicated the proportion of CAR-T cells in each group that expressed cytokines (n = 8 animals in two batches in each group). All data are means±s.d. P values were determined by Mantel-Cox log-rank test (b) or Mann-Whitney test (d) or Multiple t test adjusted by the Holm-Sidak method (f). WT CAR-T (-CsA) as blue circle, WT CAR-T (+CsA) as blue square, IRU CAR-T (-CsA) as red circle, and IRU CAR-T (+CsA) as red square. Abbreviations: i.v. intravenous injection; i.p. intraperitoneal injection.

