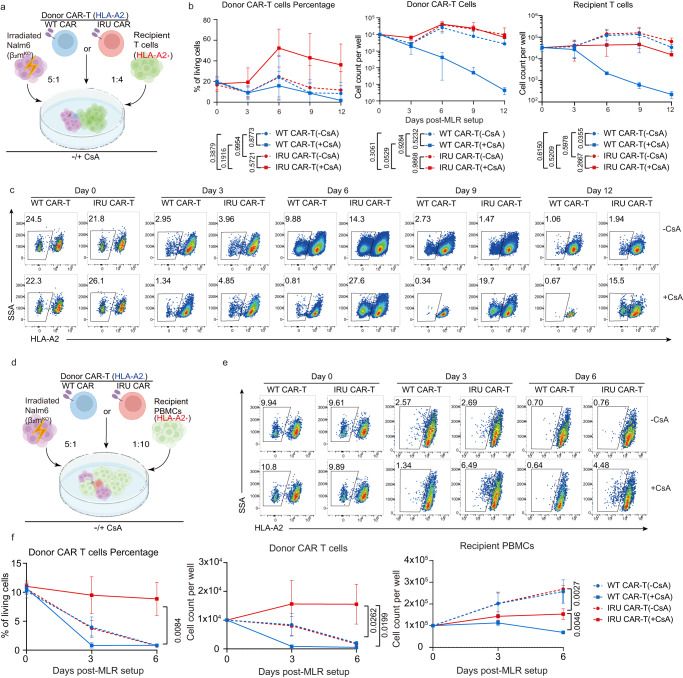
Fig. 4. The survival of IRU CAR-T cells is not reduced in the presence of recipient T cells with CsA in vitro.
a Schematic of MLR-RTCs for b, c (n = 3 biologically independent samples). Donor CAR-T (WT/IRU CAR, HLA-A2-) were mixed with 4-fold recipient T cells (HLA-A2+) and 5-fold irradiated (50 Gy) Nalm6-FFluc-GFP-β2mKO with or without CsA. b, c Curve chart showing percentage of donor CAR-T cells at day 0, 3, 6, 9, and 12 (b, left), absolute cell counts of donor CAR-T cells (b, middle) and recipient T cells (b, right), and representative flow plots (c top: -CsA group; bottom: +CsA group). P values means the significance among four groups at day 12. d Schematic MLR- PBMCs for e, f (n = 3 biologically independent samples). Donor CAR-T (WT/IRU CAR; HLA-A2-) were mixed with 10-fold recipient PBMCs (HLA-A2+) and 5-fold irradiated (50 Gy) Nalm6-FFluc-GFP-β2mKO with or without CsA. e, f Representative flow plots (e, top: -CsA group; bottom: +CsA group) and a curve chart (f, left) showing percentage of donor CAR-T cells at day 0, 3 and 6, and curve charts of absolute cell counts of donor CAR-T cells (f, middle) and recipient PBMCs (f, right). P values means the significance among four groups at day 6. All data are means±s.d. P values were determined by Multiple t test adjusted by the Holm-Sidak method (c and f). WT CAR-T (-CsA) as blue circle, WT CAR-T (+CsA) as blue square, IRU CAR-T (-CsA) as red circle and IRU CAR-T (+CsA) as red square.

