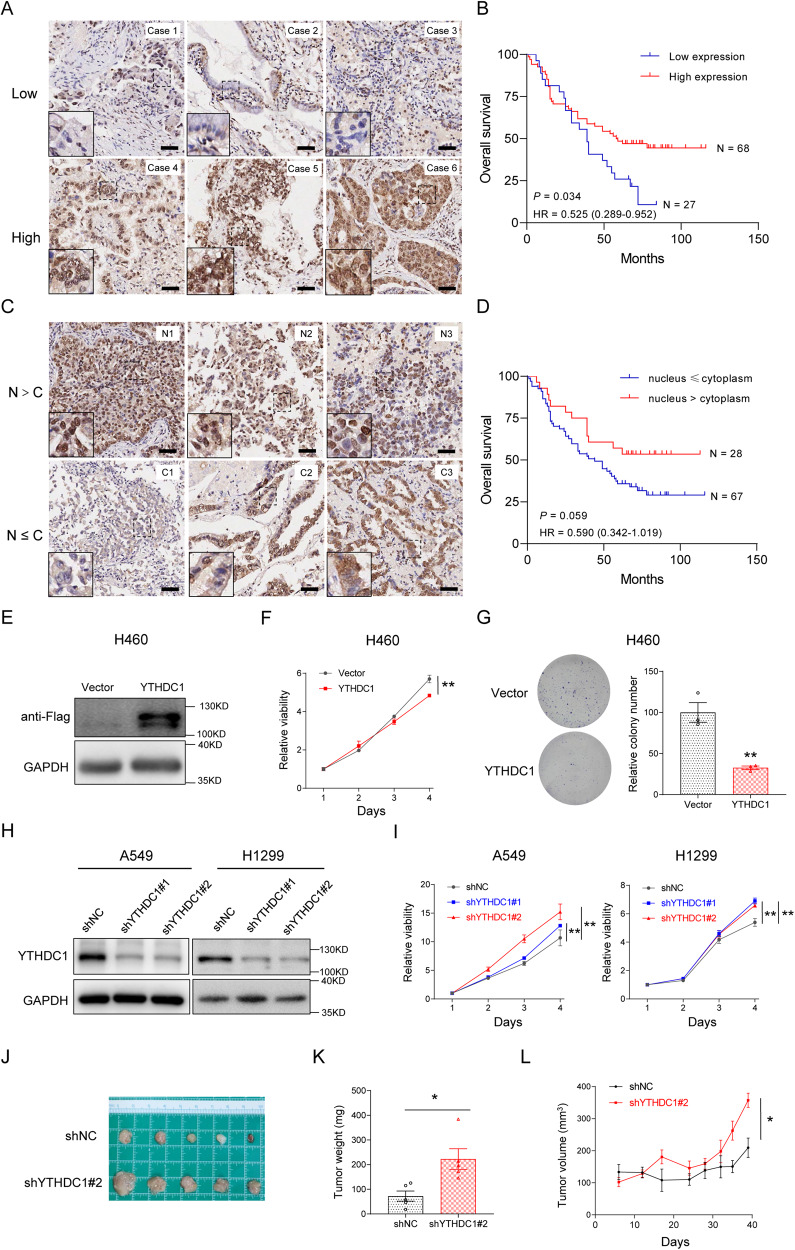
Fig. 2. YTHDC1 suppresses lung cancer progression.
A Low and high protein levels of nuclear YTHDC1 in representative lung cancer tissues by immunohistochemical staining. Scale bars represent 50 μm. For each case, immunostaining score with a potential range of 0–300 is calculated as follows: Immunostaining score = [extent of positive cell staining (0–100%) × staining intensity (0–3)] × 100. High YTHDC1 protein level group contains the immunostaining score >75 patients. Low YTHDC1 protein level group contains the immunostaining score ≤75 patients. B Kaplan–Meier curves for overall survival of lung cancer patients (n = 95) with high and low protein levels of YTHDC1. C Representative immunohistochemical staining of lung cancer tissues with dominant nuclear (upper) or dominant cytoplasmic (lower) YTHDC1 level. Scale bars represent 50 μm. D Kaplan–Meier curves for overall survival of lung cancer patients (n = 95) with dominant nuclear and dominant cytoplasmic YTHDC1 level. E The protein levels of YTHDC1 are detected by WB using anti-Flag antibody in H460 cells after overexpression of Flag-tagged YTHDC1. F Cell proliferation is detected by CCK-8 assays after overexpression of YTHDC1 in H460 cells. The difference between cell proliferation curves is evaluated using repeated measures analysis of variance. G Colony formation assays are conducted after overexpression of YTHDC1 in H460 cells. H The knockdown effects of YTHDC1 by shRNA are detected using WB in A549 and H1299 cells. I Cell proliferation is detected by CCK-8 assays after stable knockdown of YTHDC1 in A549 and H1299 cells. The difference between cell proliferation curves is evaluated using repeated measures analysis of variance. J Subcutaneous xenograft tumors are dissected and photographed. K The tumor weight of A549 cells with stable knockdown of YTHDC1 or control. Results of tumor weight are evaluated using the two-tailed Student’s t-test. L The tumor growth curve of A549 cells with stable knockdown of YTHDC1 or control. The difference between tumor growths curves is evaluated using repeated measures analysis of variance. *P < 0.05; **P < 0.01.

