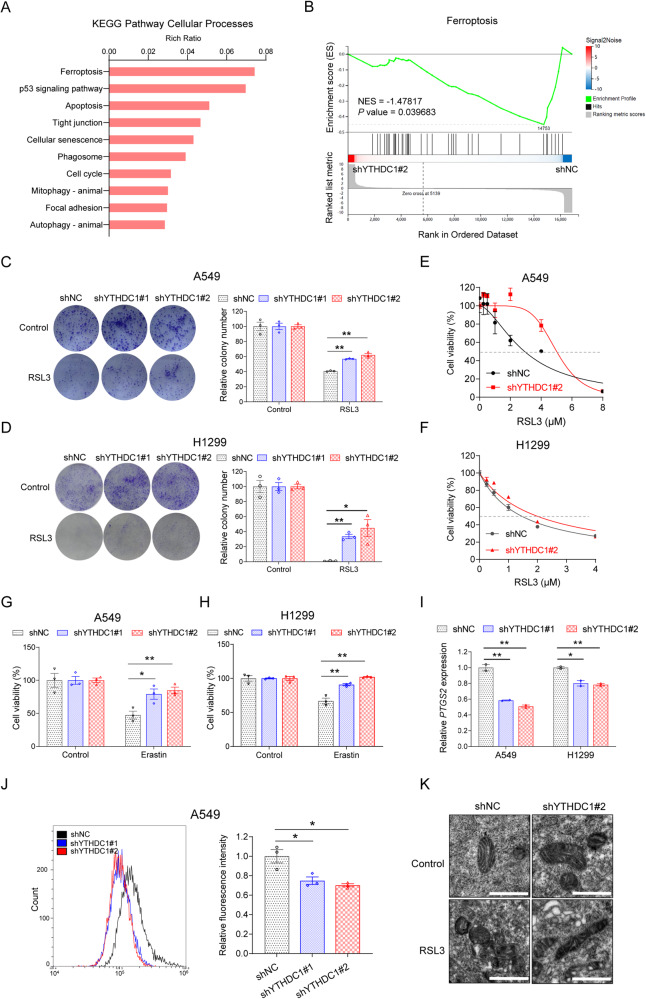
Fig. 3. YTHDC1 promotes ferroptosis activity.
A Genome-wide gene expressions are detected by RNA-seq in A549 cells with stable knockdown of YTHDC1 and Kyoto encyclopedia of genes and genomes (KEGG) pathway analysis is conducted using differentially expressed genes induced by stable knockdown of YTHDC1. B Gene set enrichment analysis (GSEA) shows that ferroptosis system is altered in YTHDC1 knockdown cells compared with control cells in A549 cells. C, D Colony formation assays are conducted to clarify the effect of YTHDC1 on the RSL3-induced ferroptosis in A549 and H1299 cells. Results are evaluated using the two-tailed Student’s t-test. E, F RSL3 treatment is conducted to clarify the effect of YTHDC1 on the ferroptosis in A549 and H1299 cells. Cell proliferation is detected by CCK-8 assays and IC50 curves are generated using Graphpad Prism 8.0. G, H CCK-8 assays are conducted to clarify the effect of YTHDC1 on the Erastin-induced ferroptosis in A549 and H1299 cells. Results are evaluated using the two-tailed Student’s t-test. I The expression levels of PTGS2 are detected in A549 and H1299 cells treated with RSL3 for 48 h. Results are evaluated using the two-tailed Student’s t-test. J ROS are detected by flow cytometry. A549 cells are treated with RSL3 (800 nM) for 24 h, followed by incubation with DHE for 60 min at 37 °C. Results are evaluated using the two-tailed Student’s t-test. K Morphological changes of ferroptosis are detected using transmission electron microscopy. Scale bars represent 1 μm. *P < 0.05; **P < 0.01.

