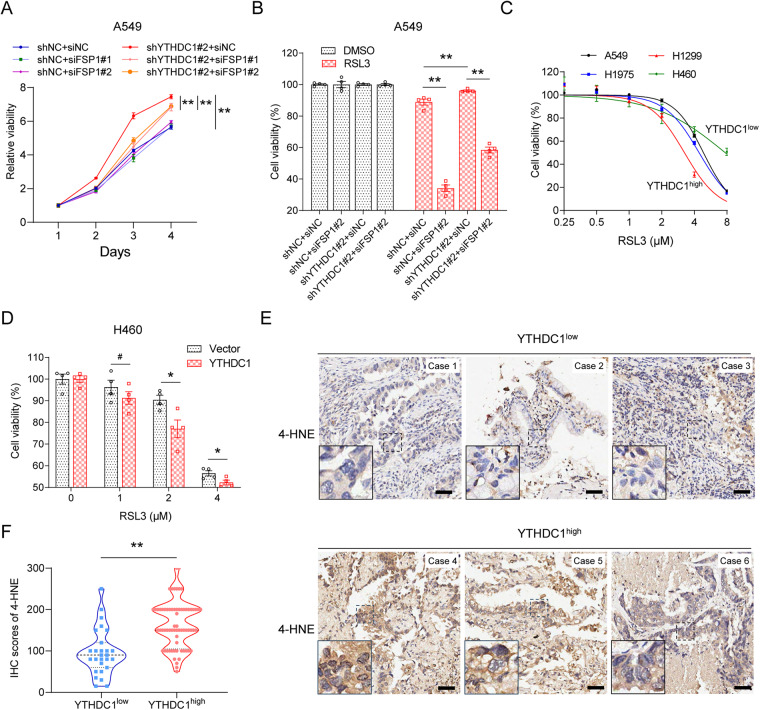
Fig. 6. YTHDC1 provides a ferroptotic vulnerability for lung cancer treatment.
A Cell proliferation is detected by CCK-8 assays after transfection with siRNA targeting FSP1 in shNC and shYTHDC1 A549 cells. The difference between cell proliferation curves is evaluated using repeated measures analysis of variance. B RSL3 treatment is conducted to clarify the rescue effect of FSP1 on the ferroptosis resistance induced by YTHDC1 knockdown in A549 cells. Cell proliferation is detected by CCK-8 assays. Results are evaluated using the two-tailed Student’s t-test. C RSL3 treatment is conducted to compare the ferroptosis sensitivity in lung cancer cells with different YTHDC1 protein levels. Cell proliferation is detected by CCK-8 assays and IC50 curves are generated using Graphpad Prism 8.0. D RSL3 treatment is conducted to compare the ferroptosis sensitivity in H460 cells after overexpression of YTHDC1. E Immunohistochemical staining of lung cancer tissues with 4-HNE in the same lung tumor tissues as Fig. 2A. Scale bars represent 50 μm. F IHC scores of 4-HNE in YTHDC1low and YTHDC1high lung tumor tissues are compared using Wilcoxon rank-sum test. YTHDC1low and YTHDC1high lung tumor tissues are defined as Fig. 2A. #P > 0.05; *P < 0.05; **P < 0.01.

