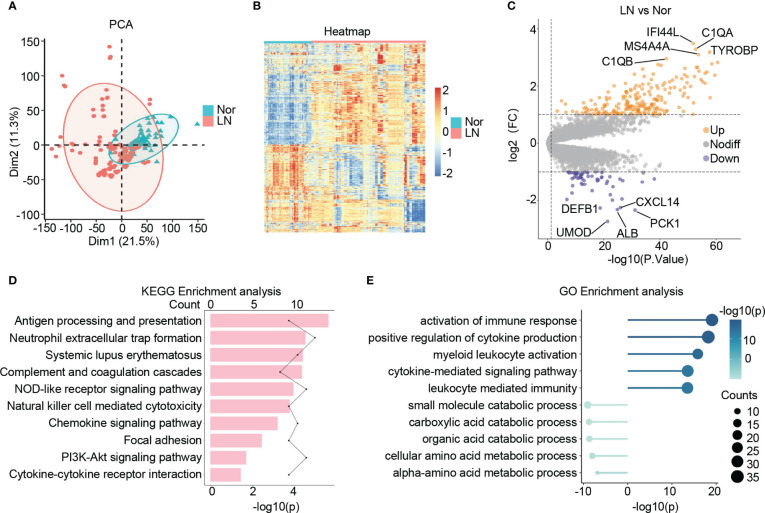
Figure 2.
Identification of the DEGs in lupus nephritis. (A) The principal component analysis (PCA) showing the distribution of samples in patients with lupus nephritis and normal controls. (B) The heatmap illustrating the top 1000 genes with the highest standard deviation changes among individuals diagnosed with lupus nephritis and normal controls. (C) The volcano showing the expression of DEGs between lupus nephritis and normal controls. (D) The bar graph illustrating the significantly upregulated KEGG pathways in lupus nephritis compared to the normal controls. (E) The lollipop graph illustrating the upregulated(right) and downregulated(left) GO terms in lupus nephritis compared to the normal controls.

