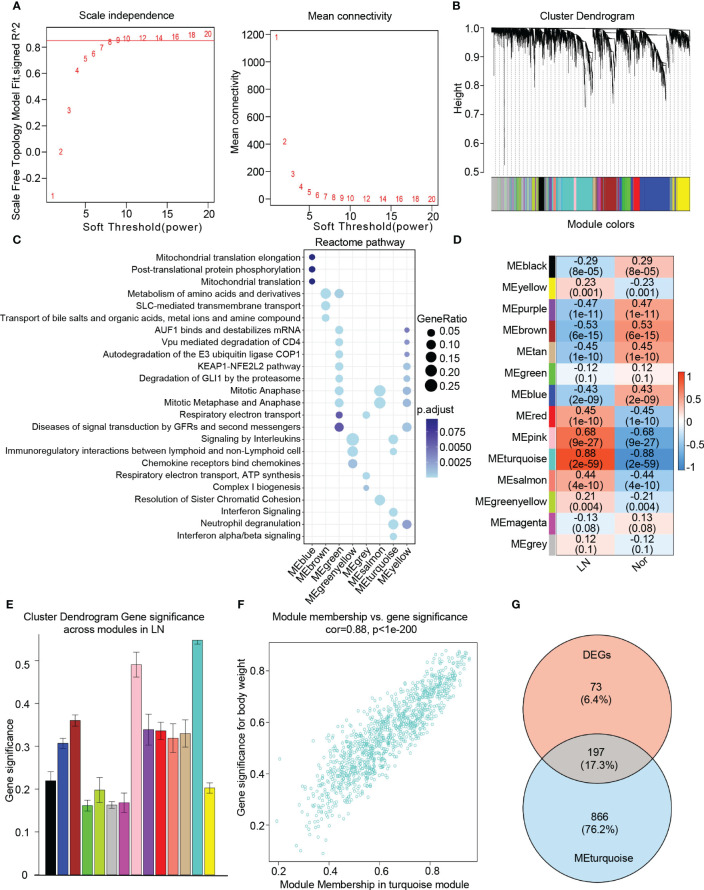
Figure 3.
Identification of candidate hub genes based the WGCNA analysis. (A) The soft threshold power(left) and mean connectivity(right) of WGCNA network. (B) The cluster dendrogram of WGCNA network. (C) The dot plot showing the top enriched reactome pathways among different modules. (D) The heatmap depicting the relationship between the modules and clinical traits, specifically lupus nephritis and normal controls. (E) The bar chart illustrating the gene significance among different modules in lupus nephritis. (F) The scatter plot between gene significance (GS) and module members (MM) in turquoise module. (G) The venn diagram of the intersection of DEGs, turquoise module genes.

