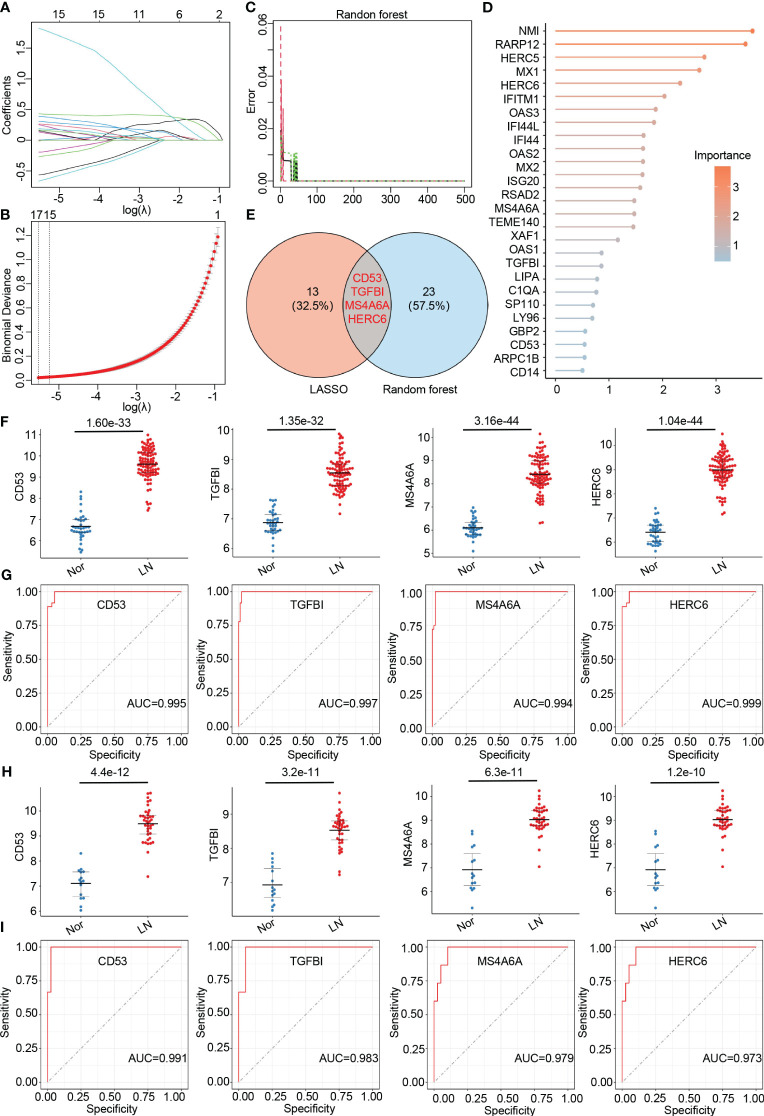
Figure 4.
Identification of final hub genes by lasso regression analysis and random forest analysis. (A) Path diagram of the LASSO coefficients for the hub genes associated with lupus nephritis in training group. (B) LASSO regression cross-validation curve. Optimal λ values were determined using 10-fold cross-validation in training group. (C) The error rate confidence intervals for random forest mode in training group. (D) The lollipop graph illustrating the relative importance of genes in the random forest model within training group. (E) The venn diagram of the intersection of LASSO and random forest signature genes. (F) Expression levels of four hub genes in lupus nephritis patients compared with normal controls in training group. (G) ROC analysis of four hub genes in training group (H) Expression levels of four hub genes in lupus nephritis patients compared with normal controls in validation group. (I). ROC analysis of four hub genes in validation group.

