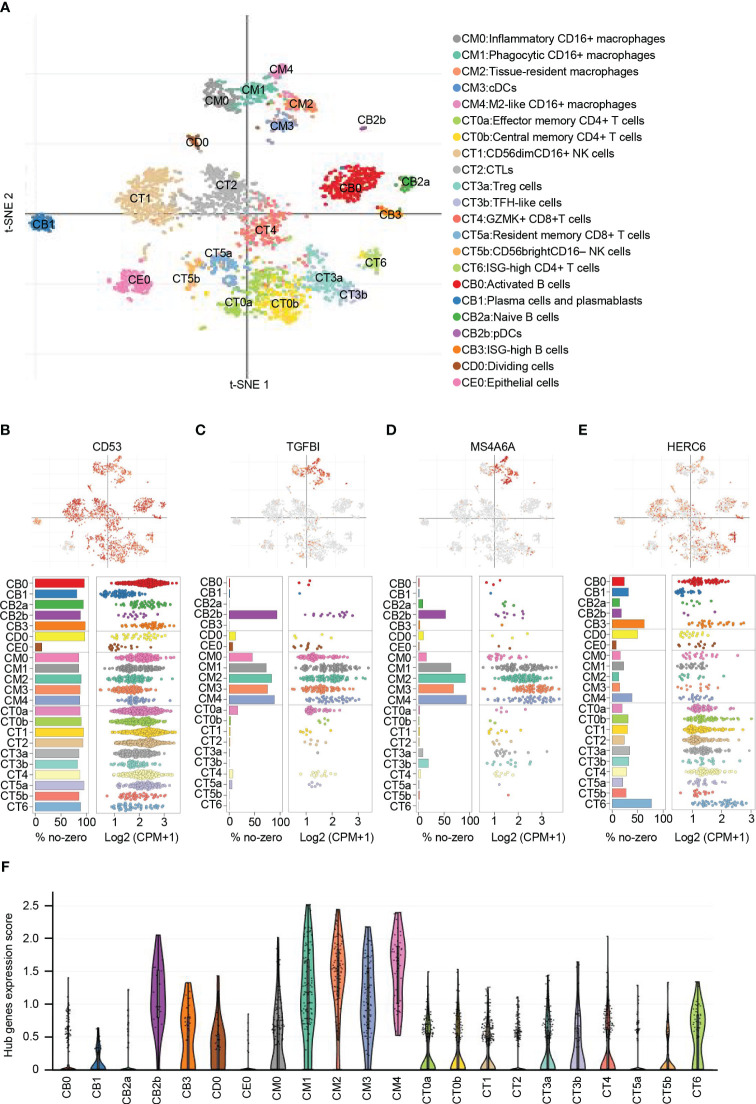
Figure 8.
Distribution and expression of hub genes based on the single-cell RNA sequencing data. (A) t-SNE plot showing the 22 identified cell clusters. (B) Featureplot, bar plot and dot plot showing the distribution and expression of CD53. (C) Featureplot, bar plot and dot plot showing the distribution and expression of TGFBI. (D) Featureplot, bar plot and dot plot showing the distribution and expression of MS4A6A. (E) Featureplot, bar plot and dot plot showing the distribution and expression of HERC6. (F) Violin plots showing combined expression scores of hub genes.

