FIGURE 5.

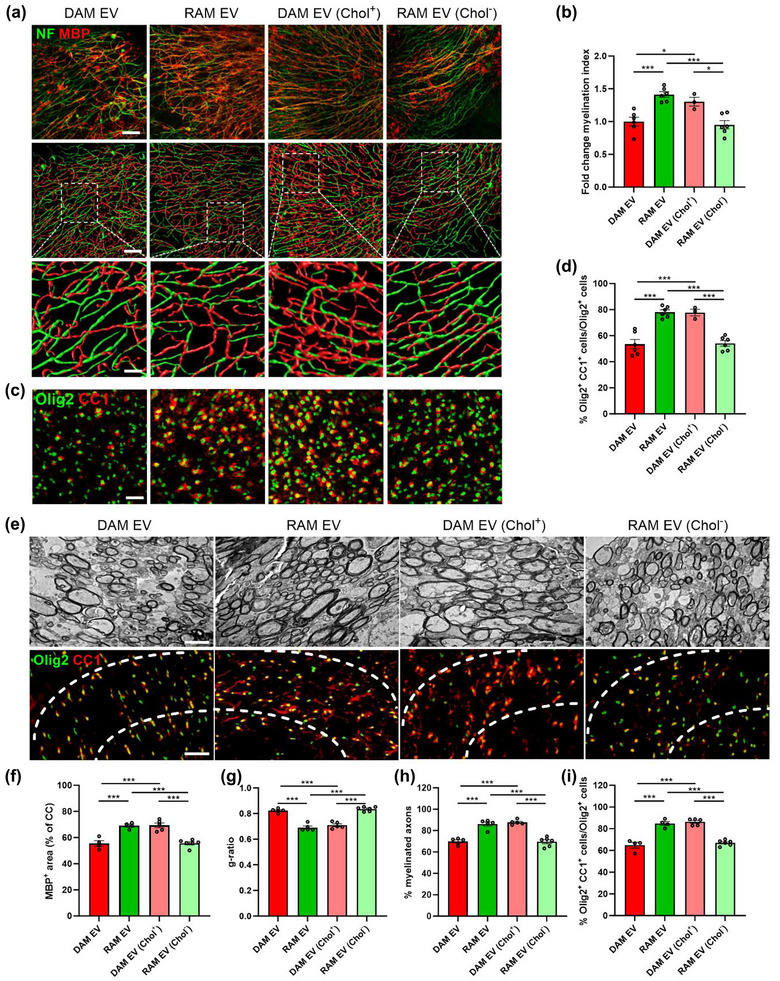
Cholesterol abundance controls the impact of EVs released by macrophages on remyelination. (a–d) Representative images, three‐dimensional reconstruction, and quantification of immunofluorescent MBP/NF (a, b) and Olig2/CC1 stains (c, d) of cerebellar brain slices treated with vehicle or EVs released by disease‐associated macrophages (DAMs, LPS‐stimulated), and repair‐associated macrophages (RAMs, IL‐4‐stimulated), as well as EVs released by DAMs and RAMs that were enriched (Chol+) with or depleted (Chol−) of cholesterol, respectively. Relative number of MBP+ NF+ axons out of total NF+ axons (b) and percentage Olig2+ CC1+ cells within the Olig2+ cell population (d) in cerebellar brain slices treated with vehicle or EVs is shown (n = 3–6 slices). Slices were treated with 4 × 10⁹ EVs/mL. Scale bars, 100 µm (a (row 1 and 2), c); 25 µm (a (row 3)). (e) Representative images of transmission electron microscopy analysis and immunofluorescent Olig2/CC1 stains of the corpus callosum (CC) from mice treated with vehicle or EV subsets. The outer border of the CC is demarcated by the dotted line. Mice were intracerebroventricularly injected with vehicle or EVs (1 × 10⁹ EVs/mL) after demyelination (5w), and analysis was done during remyelination (5w+1). Scale bar, 200 µm (rows 1, 3) and 2 µm (row 2). (f) Quantification of the MBP+ area of the CC from cuprizone mice treated with vehicle or EVs during remyelination (5w+1) (n = 4–6 animals, 3 images/animal). (g, h) Analysis of the g‐ratio (the ratio of the inner axonal diameter to the total outer diameter, (g), and percentage of myelinated axons (h) in CC from cuprizone mice treated with vehicle or EVs during remyelination (5w+1) (n = 5–6 animals, 3 images/animal, 100–150 axons/image). (i) Quantification of the percentage Olig2+ CC1+ cells out of total Olig2+ cells in the CC of cuprizone animals treated with vehicle or EVs during remyelination (5w+1) (n = 4–6 animals, 3 images/animal). Data are represented as mean ± SEM and statistically analysed using the Kruskal–Wallis test followed by Dunn's multiple comparison test. *, p < 0.05; **, p < 0.01; ***, p < 0.001.
