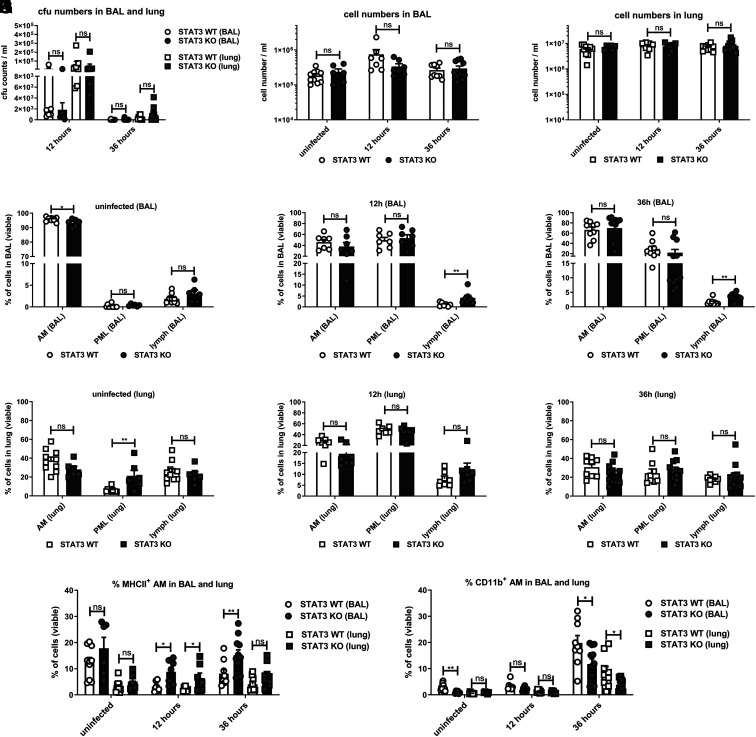
FIGURE 4.
Major cell distributions in BAL and lung during intratracheal staphylococcal infection in mice with and without myeloid STAT3 deficiency. STAT3 KO and WT mice were infected intratracheally with a sublethal dose of S. aureus 8325-4 (∼5 × 10⁶ CFU) or an equivalent dose of PBS (uninfected). Mice were followed for 12 or 36 h. Then, BAL was performed, and lungs were harvested. (A) CFU counts were determined in BAL and lung cell suspensions via serial dilution plating prior to centrifugation and supernatant filtration. Supernatants were stored, and the remaining cell pellets were further processed by red cell lysis and washes. (B and C) Total cell numbers were counted with a cell counter. The cell suspensions were then further analyzed by multicolor flow cytometry. The gating strategy is displayed in Supplemental Fig. 2. (D–I) Display of AM, neutrophil granulocytes (PML), and lymphocytes (lymph) in (D, G) uninfected state, (E, H) at 12 h, and (F, I) at 36 h in BAL and lung, respectively. (J and K) MHCII and CD11b upregulation in AM was analyzed in more detail in the respective groups in the uninfected state, at 12 h, and at 36 h in BAL or lung cell suspension. Displayed are (J) MHCII+ AM and (K) CD11b+ AM in BAL and lung. Pooled data (mean with SEM) from n = 3 independent experiments are shown. A nonparametric Mann–Whitney test was used for statistical analysis. p > 0.05 not significant; *p ≤ 0.05, **p ≤ 0.01.

