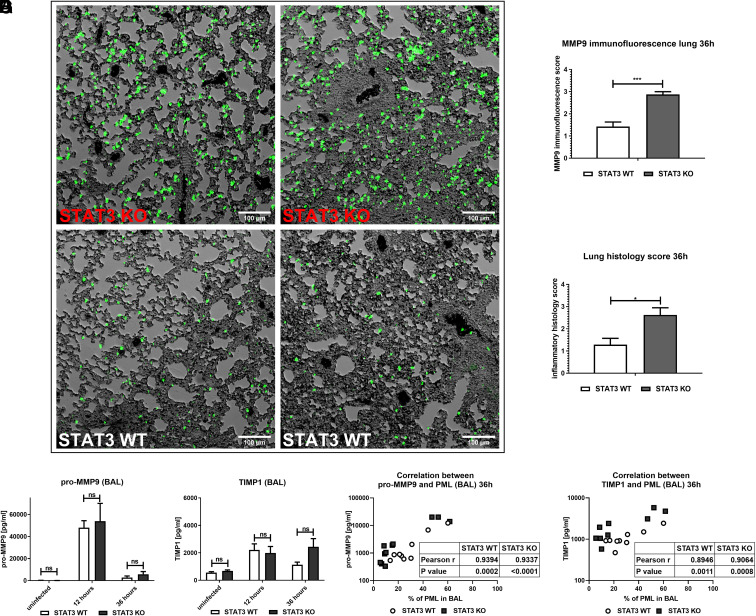
FIGURE 5.
Augmented MMP9 expression in the lung during murine pulmonary S. aureus infection. STAT3 KO and WT mice were infected intratracheally with a sublethal dose of S. aureus 8325-4 (∼5 × 10⁶ CFU). Mice were followed for 12 or 36 h. Then, BAL was performed. In some experiments, lungs were removed and fixed in 10% formalin without prior performance of BAL. Samples were then embedded in paraffin. For microscopic analysis, sections were cut and put on slides. (A and B) Slide sections were subjected to immunofluorescence staining for MMP9 and analyzed with a DeltaVision microscope. Images were subjected to standardized analysis with macros in ImageJ. (A) Exemplary images of both STAT3 KO and WT lungs infected with S. aureus for 36 h (objective 20×, dimensions 2048 × 2048). (B) Nine images of each slide were taken, analyzed, and scored. (C) Routine histological H&E staining and histological scoring were performed by an independent pathologist in a blinded manner. The histological scores (B and C) were analyzed by nonparametric Mann–Whitney test. Pooled data (mean with SEM) from n = 2 independent experiments with three or more STAT3 WT/KO mice per group are shown. (D–G) BAL supernatants were analyzed by ELISA for (D) pro-MMP9 and (E) TIMP1 in uninfected mice and infected mice at 12 h and 36 h of infection. (F and G) Correlation analysis was performed between (F) pro-MMP9 and (G) TIMP1 levels and percentage of neutrophils in BAL at 36 h. Pooled data (mean with SEM) from n = 3 independent experiments are shown. A nonparametric Mann–Whitney test was used for statistical analysis of (B)–(E), and Pearson correlation analysis was performed to assess the correlation in (F) and (G). p > 0.05 not significant; *p ≤ 0.05, ***p ≤ 0.001.

