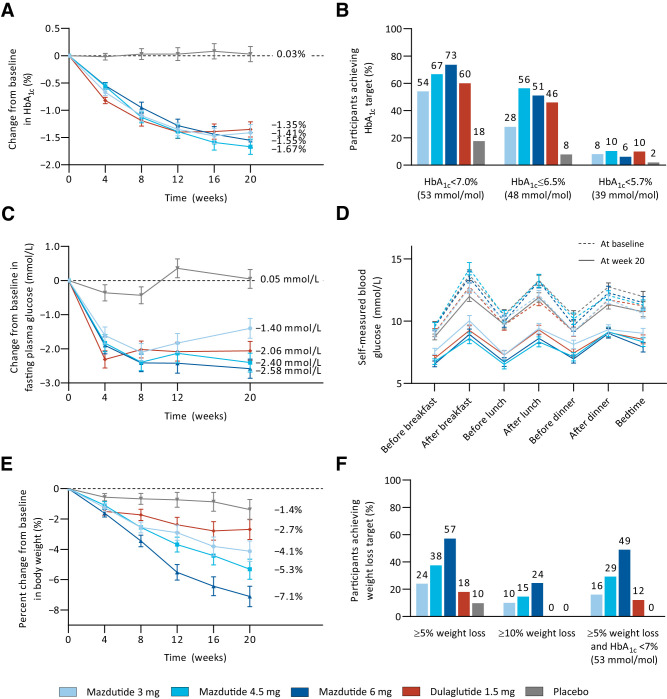
Figure 2.
Changes in HbA1c, fasting plasma glucose (FPG), and body weight over time; proportion of participants achieving HbA1c and weight loss targets; and self-measured blood glucose (SMBG) profiles. A: Change from baseline in HbA1c over time. B: Proportion of participants reaching HbA1c targets. C: Change from baseline in FPG over time. D: SMBG profiles at baseline and week 20. E: Percent change from baseline in body weight over time. F: Proportion of participants reaching weight loss targets. Data in A, C, D, and E are plotted as least squares mean ± SE from an MMRM analysis of the mITT population. Proportion of participants reaching HbA1c (B) or weight loss (F) targets was obtained by dividing the number of participants reaching the respective target at week 20 by the number of participants in the mITT population. Participants numbers were as follows: 3 mg mazdutide n = 50, 4.5 mg mazdutide n = 48, 6 mg mazdutide n = 49, placebo n = 51, and dulaglutide n = 50.

