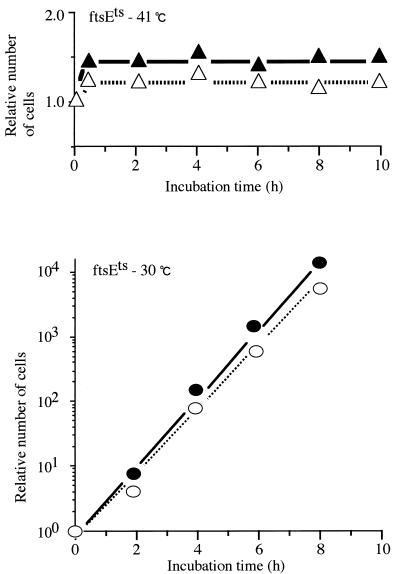
FIG. 3.
Cell division of ftsE(Ts) in K200 and K10 media. Numbers of cells in the ftsE(Ts) cultures shown in Fig. 2 were measured by using a Coulter counter. The numbers were corrected for the dilution factors and plotted relative to the numbers of the 0-h samples. ▴, ftsE(Ts) grown in K10 at 41°C; ▵, ftsE(Ts) grown in K200 at 41°C; •, ftsE(Ts) grown in K10 at 30°C; ○, ftsE(Ts) grown in K200 at 30°C.

