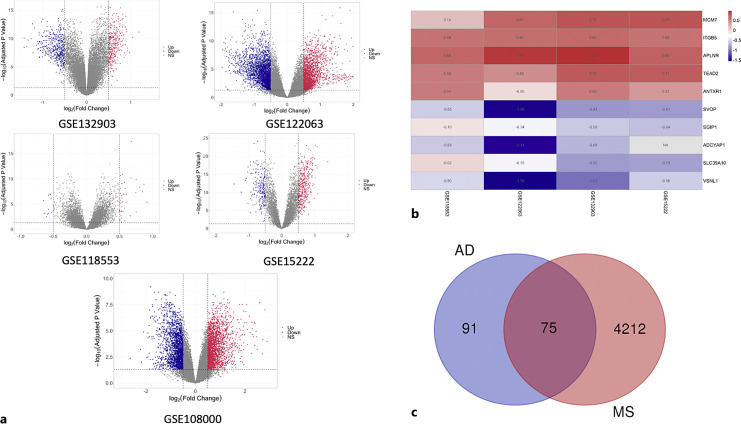
Fig. 2.
DEGs identification in each dataset and common DEGs between AD and MS. a The volcano plots show the expression pattern of DEGs in each dataset. Red: significantly upregulated; blue: significantly downregulated; gray: no significant difference. b Heatmap of the top 5 upregulated (red) and the top 5 downregulated DEGs (blue) determined by RRA method in the four AD datasets. c Venn plot of common DEGs between AD and MS.

