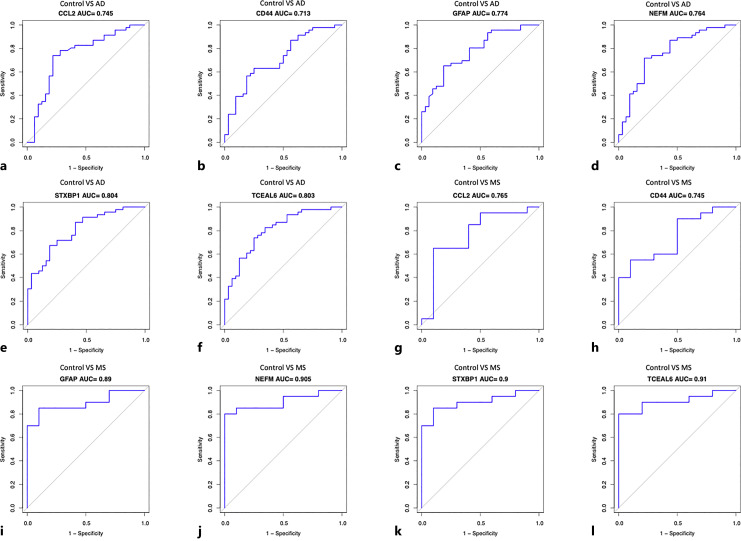
Fig. 8.
ROC curve analysis evaluates the sensitivity and specificity of six hub genes as predictive biomarkers for AD and MS diagnosis. CCL2 in AD (a); CD44 in AD (b); GFAP in AD (c); NEFM in AD (d); STXBP1 in AD (e); TCEAL6 in AD (f); CCL2 in MS (g); CD44 in MS (h); GFAP in MS (i); NEFM in MS (j); STXBP1 in MS (k); TCEAL6 in MS (l).

