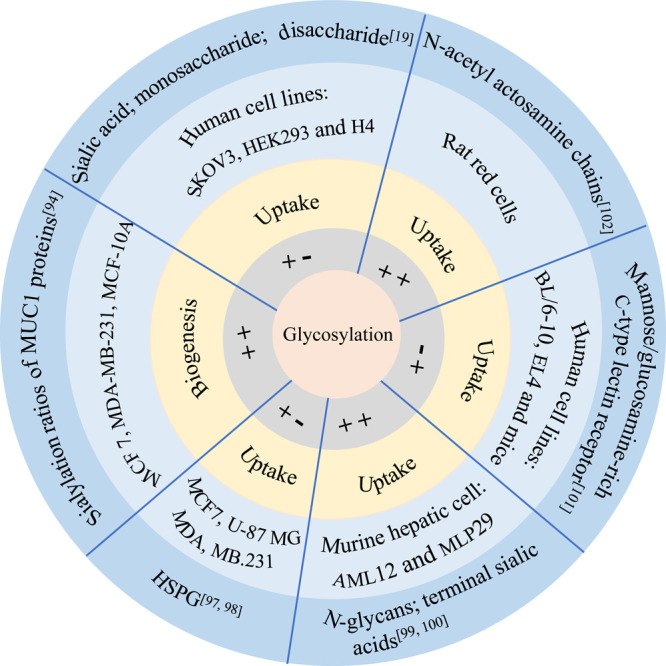
Figure 4.

Schematic representation illustrating the influence of glycosylation on the biogenesis and uptake of EVs. In the gray circle, “++” indicates that glycosylation is positively correlated with EVs, whereas “+–” indicates that glycosylation is negatively correlated with EVs. In the orange ring, the text annotates the correlation between glycosylation and the biogenesis or uptake of EVs. In the light blue circle and the dark blue ring, the text annotates the sample of the study and the type of glycosylation, respectively.
