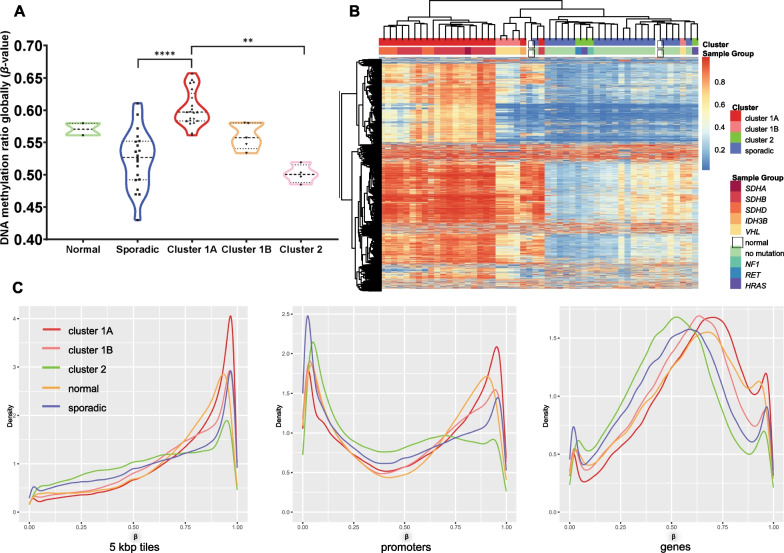
Fig. 1.
A Average DNA methylation levels from all the probes of the 850 K array: Cluster 1A tumours are significantly more methylated than sporadic (p < 0.0001, Kruskal–Wallis test) and Cluster 2 (p = 0.0014) tumours. In Cluster 1A, SDHB samples are shown as triangle and all the other samples with a star symbol. B Unsupervised hierarchical clustering of all samples based on the DNA methylation levels of the 5000 most variable probes. Three distinct groups are observed, largely coinciding with the clusters described in the literature previously. The SDHx tumours form a separate cluster with the VHL tumour, while sporadic and Cluster 2 tumours form one uniform group. C Comparison of β-value densities across samples from each group. Cluster 1A tumours have a higher peak on more methylated regions when the genome is divided in 5 Kbp-tiles agnostic of content and in both promoter and gene bodies

