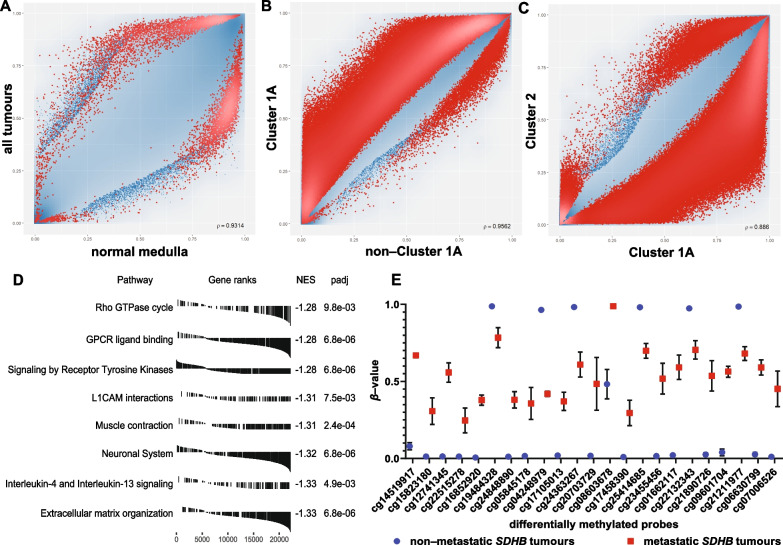
Fig. 2.
A–C Scatterplots for differentially methylated sites genome wide. Each point represents a probe of the 850 K array, and significantly differentially methylated probes (FDR < 0.05) are marked with red. Cluster 1A has the highest number of differentially methylated sites when compared to all other tumour samples (non-Cluster 1A) (B) or when compared only to Cluster 2 (C). D Top 10 gene set enrichment analysis (GSEA) results on differentially methylated promoters in Cluster 1A tumours after collapsing the redundant pathways with their corresponding gene-rank plots. Receptor tyrosine kinase and MAPK signalling pathways and the extracellular matrix are amongst the most affected. NES: normalised enrichment score. F: β-values of differentially methylated probes between metastatic and non-metastatic SDHB tumours. In the case of non-metastatic tumours, DMPs are in a binary state, mostly completely unmethylated with some completely methylated. In contrast, these loci in metastatic tumours have intermediate methylation levels. Mean ± standard deviation error bars

