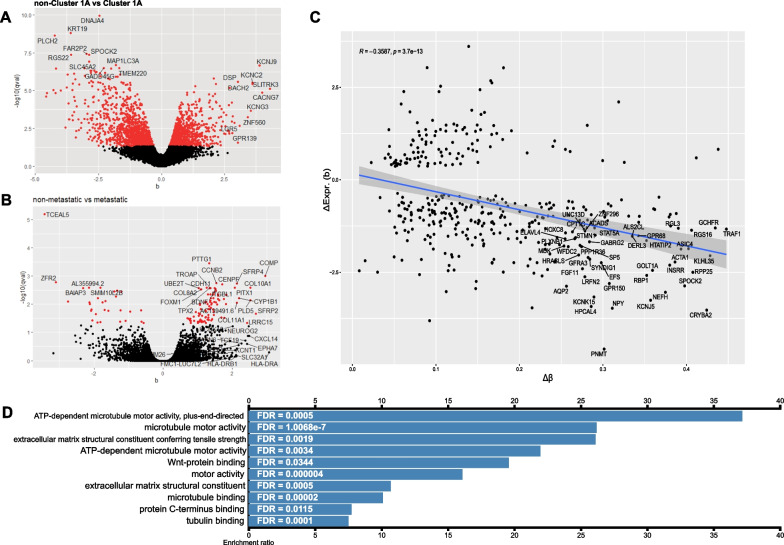
Fig. 4.
A–B Volcano plots showing the effect size (b) of differential gene expression and its statistical significance for the comparisons Cluster 1A versus non-Cluster 1A and metastatic versus non-metastatic tumours from the RNA-seq data. C Correlation plot of differentially methylated promoters and differentially expressed genes in metastatic tumours shows an inverse relationship between the more differentially methylated (higher Δβ) and the level of downregulation. Pearson’s correlation coefficient ρ = −0.3587, p = 3.7 × 10⁻¹³. D Over-representation analysis of upregulated differentially expressed genes between metastatic and non-metastatic tumours for molecular function ontology revealed enriched terms were mainly related to motor proteins, the Wnt-pathway and the extracellular matrix

