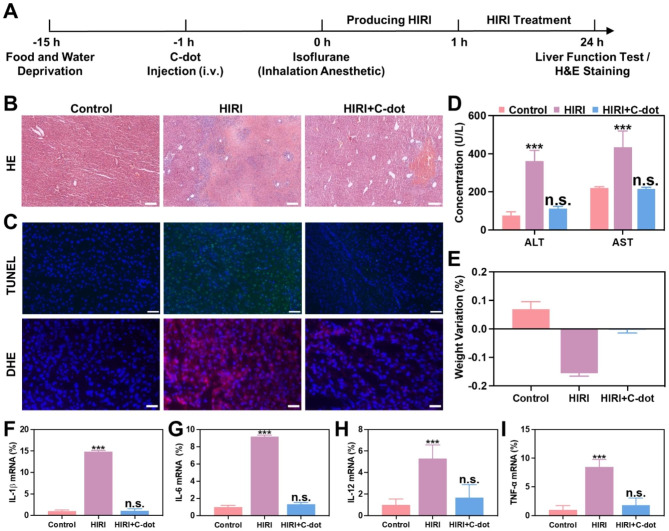
Fig. 6.
Protective effects of C-dots on HIRI in vivo. (A) The diagram depicts the setup and plan for treating HIRI mice. (B) H&E staining was performed on liver tissues. Scale bar: 100 μm. (C) Liver tissues were subjected to TUNEL assay and Dihydroethidium (DHE) staining. Scale bar: 50 μm. (D) After various treatments, the levels of ALT and AST in the serum of HIRI mice were measured at 24 h. (E) The change in weight of HIRI mice 24 h after being administered with C-dots. Expression levels of mRNAs for cytokines of IL-1β (F), IL-6 (G), IL-12 (H), TNF-α (I) mRNA were comparatively analyzed

