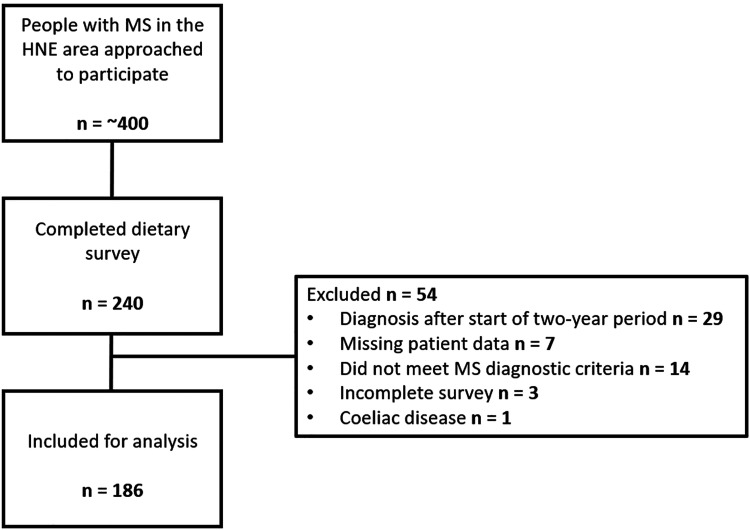
Figure 1.
Flow diagram of study participants. Study flow demonstrating the inclusion and exclusion criteria at each step. The top square shows the number of people with MS in the HNE area who were approached to participate in the study. The following square shows how many completed the dietary survey. The right-hand square indicates the number of participants that were excluded and the reason. Note: Missing data refers to insufficient data available on the local database to assess their NEDA-3 status, incomplete survey refers to surveys where the participants had inadequately completed the dietary screener. The bottom square indicates the number of participants included for final analysis. HNE: Hunter New England; MS: multiple sclerosis; NEDA-3: no evidence of disease activity 3.

