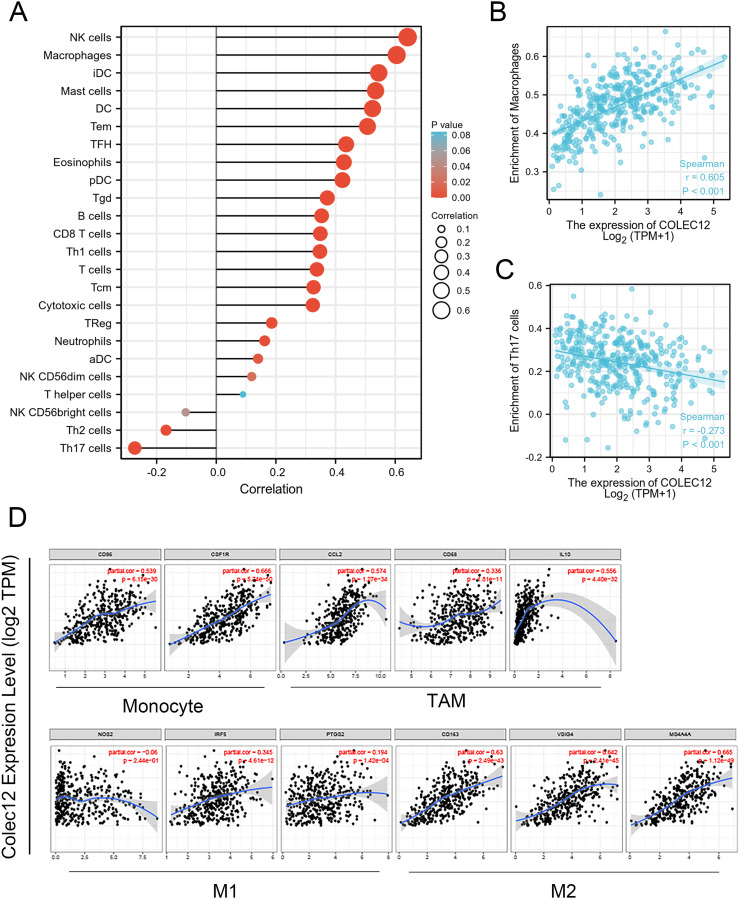
Figure 5.
Correlation of the COLEC12 expression with immune cell infiltration level in GC. (A) COLEC12 expression had a significant positive correlation with the infiltration level of NK cells, macrophages, mast cells, and DCs. (B) Scatter plots of the correlation between the COLEC12 expression and macrophages. (C) A negative correlation was detected with the infiltration level of Th17 cells. (D) Analysis of the correlation between COLEC12 and the related gene markers of macrophages in GC. Markers include CD86 and CSF1R of monocytes; CCL2, CD68, and IL10 of TAMs; NOS2, IRF5, and PTGS2 of M1 macrophages; and CD163, VSIG4, and MS4A4A of M2 macrophages. Th, T helper cells; Th1, type 1 Th cells; Th2, type 2 Th cells; Th17, type 17 Th cells; Treg, regulatory T cells; Tgd, T gamma delta; Tcm, T central memory; Tem, T effector memory; Tfh, T follicular helper; DCs, dendritic cells; aDCs, activated DCs; iDCs, immature DCs; pDCs, plasmacytoid DCs; NK, natural killer; TAMs, tumor-associated macrophages; COLEC12, Collectin subfamily member 12; GC, gastric cancer.

