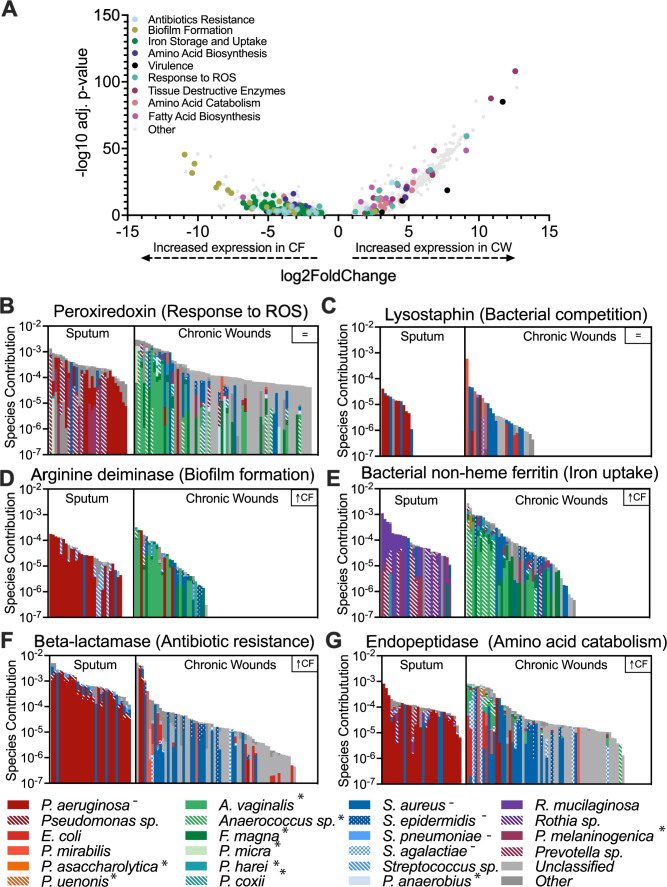
Fig 2.
Distinct expression of microbial functions in CF and CW communities. (A) Volcano plot to highlight differentially expressed functions between infection sites as identified by SAMSA2. Of the functions, 40.37% were differentially expressed (adjusted P value < 0.05, log2 fold change >1 with 1,335 and 488 functions highly expressed in CF and CW samples, respectively. (B and C) Bacterial contribution to the expression of functions conserved across CF and CW environments. (D–G) Bacterial contribution to the expression of differentially expressed functions. Species contribution (y-axis) refers to the sum of the relative abundance of the bacterial species per sample for each function in log scale.

