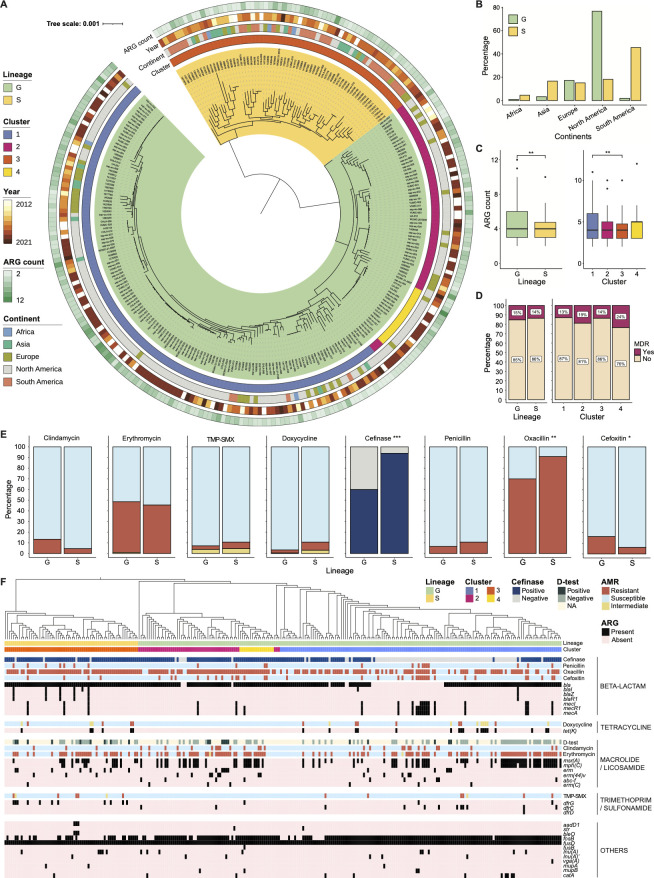
Fig 1.
Relatedness and antibiotic resistance profile of S. saprophyticus recovered globally from human infections and colonization during 2012–2021. (A) Phylogenetic tree demonstrating the core gene alignment of 275 S. saprophyticus isolates. Each node represents an isolate. Two lineages are indicated with color ranges covering the complete clade branches. Hierarchical clusters based on rhierBAPS are indicated by color strips in the internal ring. The continent of origin and year of collection, as well as the number of ARGs carried by each isolate, are labeled by color strips. The scale bar represents the average number of nucleotide substitutions. (B) Distribution of S. saprophyticus isolates in terms of their continents in the two lineages. (C) Box plot comparing the number of ARG between isolates from different lineages (left) and clusters (right). (D) Comparing multidrug resistance (MDR) rates between isolates from different lineages (left) and clusters (right). (E) Comparing percentages of isolates resistant to different antibiotics or expressing β-lactamase activity between lineages. Susceptibility phenotypes: resistant, orange; intermediate, yellow; susceptible, light blue. β-lactamase activity: positive, dark blue; negative, light gray. In D and E, the χ2 test is used with a significance threshold of 0.05. * P < 0.05, **P < 0.01, and ***P < 0.001. (F) Annotating the core gene phylogenetic tree with antibiotic resistance phenotypes, linking with the presence of various ARGs. Genotypical and phenotypical data are grouped by antimicrobial class. Lineages, clusters, resistance phenotypes, and ARG content are indicated by color strips.

