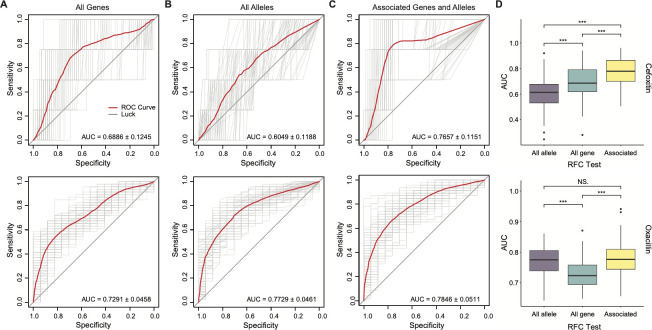
Fig 4.
Prediction performances of genotype to phenotype inference for mecA− S. saprophyticus strains against cefoxitin and oxacillin, tested by RFC. In A–D, the top panel is for cefoxitin, and the bottom panel is for oxacillin. (A) ROC curves evaluate the ability to predict the resistance phenotype based on the presence and absence of all accessary genes, presenting in at least 10 isolates. (B) ROC curves evaluate the ability to predict the resistance phenotype based on the presence and absence of all gene alleles (present in ≥10 isolates) that have been shown related to methicillin resistance in other staphylococci. (C) ROC curves evaluate the ability to predict the resistance phenotype based on the presence and absence of significant AMR-related genes and alleles identified by MaAsLin2. In A–C, the red line represents the mean ROC curves from 100 RPC tests (light gray lines), and the AUC is exhibited for each model. (D) Box plots of AUC values from 100 RPC tests of different models in A–C. NS. P ≥ 0.05 and ***P < 0.001 as determined by Wilcoxon rank-sum test.

