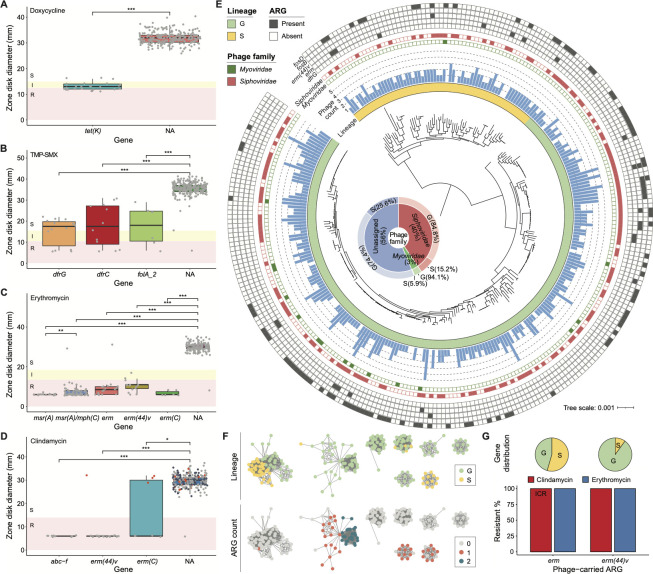
Fig 5.
Genes and phage signatures correlated with non-β-lactam resistances in S. saprophyticus. (A–D) Box plots of zone diameters from disk diffusion tests for doxycycline, TMP-SMX, erythromycin, and clindamycin susceptibility, respectively. The phenotypes are represented by colors: red for resistant, yellow for intermediate, and white for susceptible. Each gray dot denotes an individual isolate carrying a specific ARG. In D, isolates that were tested for ICR by D-test were represented as red or dots for positive or negative results. Few isolates containing different ARGs correlated with the same antibiotics are ignored. NA indicates S. saprophyticus with no related ARGs. * P < 0.05, **P < 0.01, and ***P < 0.001 as determined by Wilcoxon rank-sum test. (E) Annotating phage signatures and phage-carrying ARGs on the core gene phylogenetic tree of S. saprophyticus. The scale bar represents the average number of nucleotide substitutions. The innermost ring represents bacterial lineages by color strips. The blue bar graph shows the phage number detected in each S. saprophyticus isolate. The distribution of phages from Siphoviridae or Myoviridae family, as well as the presence/absence of ARGs carried by phages, is visualized as filled and empty symbols. The inset shows the distribution of phage taxonomy in different lineages to their bacterial host belongs. (F) Phage populations containing at least 10 phage sequences, defined by MIUVIG-recommended parameters (95% ANI and 85% alignment fraction). Each node represents a phage sequence, and an edge indicates a similarity between its nodes. The phage populations are labeled with their bacterial host lineages (top) and the number of phage-carrying ARGs (bottom). (G) Percentage of isolates non-susceptible to clindamycin [ICR for erm and constitutive resistance for erm(44)v] and erythromycin out of the total number of S. saprophyticus carrying erm and erm(44)v within their phage elements. Distributions of these two genes against lineages are shown at the top.

