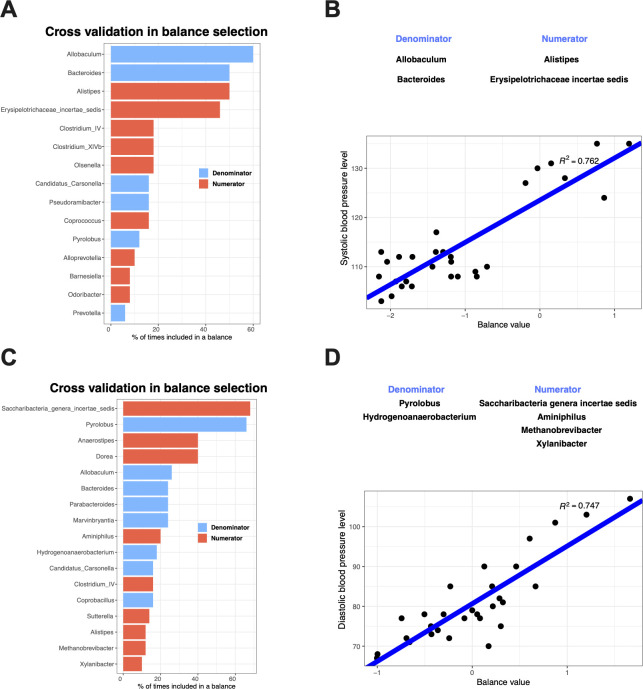
Fig 2.
The microbial balance associated with SBP (A and B) and DBP (C and D) identified with selbal analysis (A and C) cross-validation in balance selection. The barplots illustrate the stability of the most frequent balanced members during the cross-validation procedure: the blue bars correspond to the numerator members, and orange bars correspond to the denominator members. (B and D) Linear regression between the selected balances and the blood pressure level (SBP and DBP).

