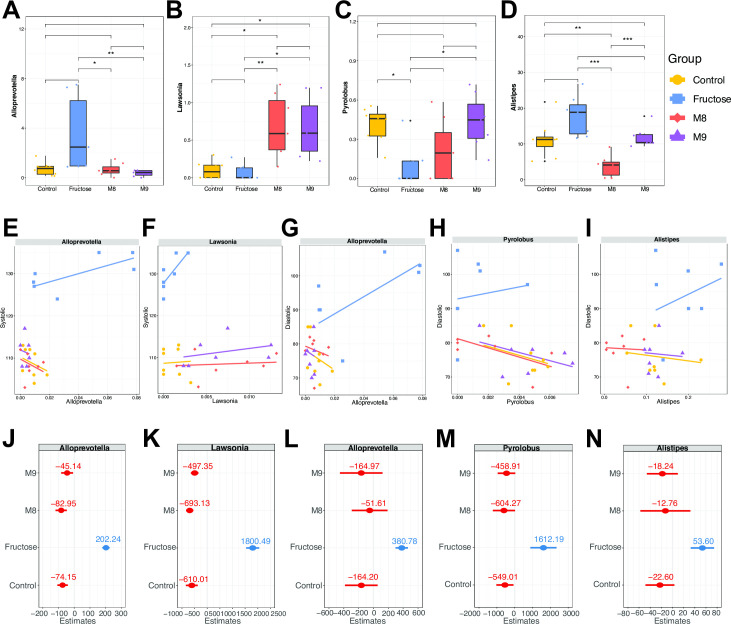
Fig 3.
The genera identified as signatures related to blood pressure show different patterns of response to different treatments. (A–D) The relative abundance level of the genera in each group. Wilcoxon test: *P < 0.05, **P < 0.01, ***P < 0.001. (E–I) The abundance of each genus regressed on the SBP (E and F) or DBP (G–I). The colored lines are the fitted regression lines for each group based on the estimated intercepts and slopes. (J–N) Estimated slopes of random factor for each genus model on the SBP (J and K) and DBP (L–N).

