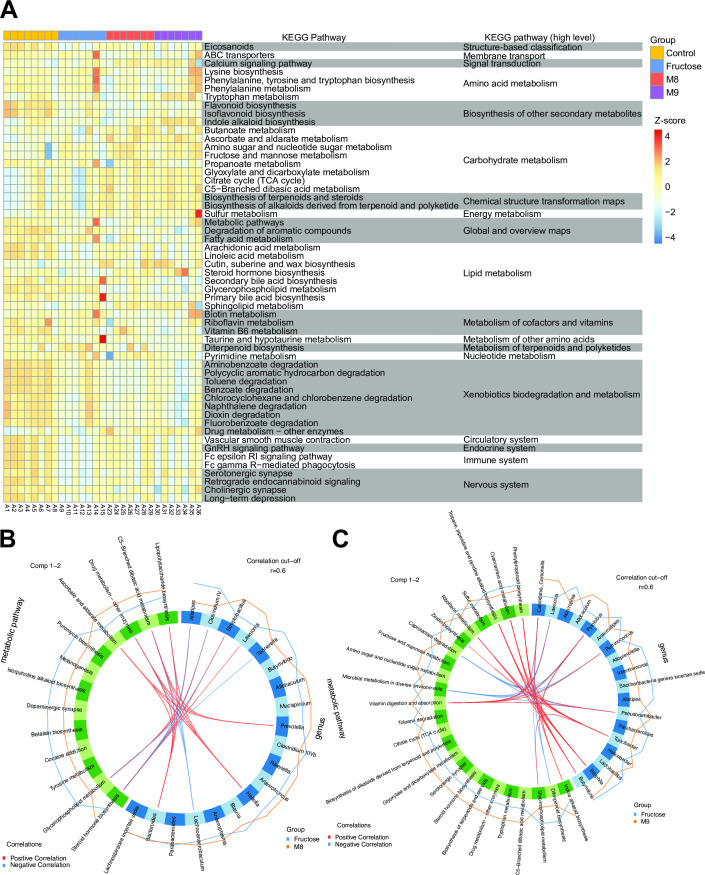
Fig 4.
Gut microbiome and serum metabolomics are strongly linked. (A) Heatmap of serum metabolic pathways showing differential activity (measured as pathway activity profiling [PAPi] score) among the four groups. For visualization, the PAPi scores were log-transformed then centered and scaled to a mean of 0 and standard deviation of 4. FDR-adjusted P value threshold was set as 0.01. (B and C) Correlations between genus and metabolic pathways identified using Spls-DA. With the correlation cutoff of 0.6 in absolute value, we identified highly correlated genus and metabolic pathways that were discriminative between the probiotics intervention group (M8, B; M9, C) and the fructose group. The orange and blue lines outside the circle represent the average abundance level of each genus (or metabolic pathways) within M8 (or M9) and fructose groups separately. TCA, tricarboxylic acid cycle.

