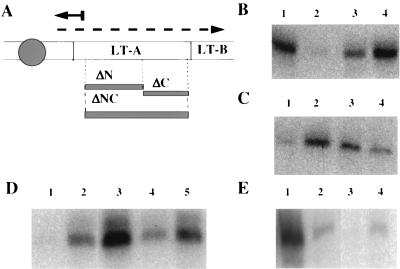
FIG. 1.
(A) Schematic representation of the LT operon and location of the DRE deletions with respect to the location of the primer extension product. LT A and LT B code for subunits of LT. Vertical bars, locations of the LT A and B structural genes; gray circle, the promoter region; dashed arrow, the LT mRNA; solid arrow, the LT primer extension product; solid bar, the LT primer; filled-in gray bars, approximate locations of the DRE deletions described in the text. (B) Effect of temperature and H-NS on LT mRNA production. Lanes: 1, hns+ pLT at 37°C; 2, hns+ pLT at 18°C; 3, hns pLT at 37°C; and 4, hns pLT at 18°C. (C) Effect of DRE deletions on LT mRNA production in an hns+ strain at 18°C. Lanes: 1, hns+ pLT; 2, hns+ pLTΔNC; 3, hns+ pLTΔN; and 4, hns+ pLTΔC. (D) Effect of DRE deletions on LT mRNA production in hns strains at 18°C. Lanes: 1, hns+ pLT; 2, hns pLT; 3, hns pLTΔNC; 4, hns pLTΔN; and 5, hns pLTΔC. (E) Effect of UCR deletion or UCR and DRE deletions on LT mRNA production in hns+ strains at 37 and at 18°C. Lanes: 1, pLT at 37°C; 2, pLTΔUCR at 37°C; 3, pLTΔUCR at 18°C; and 4, pLTΔUCRΔNC at 18°C. Exposure of the autoradiograph for panel E was five times longer than that for panels B to D.

