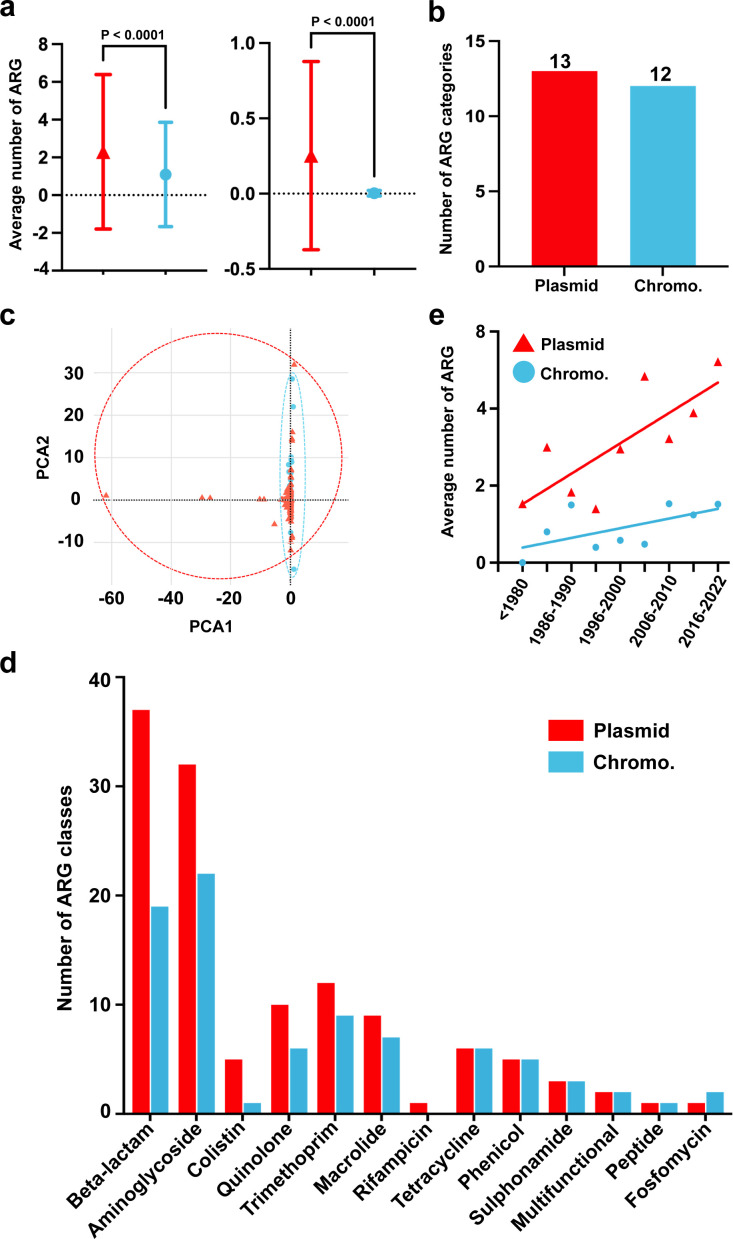
Fig 3.
Prevalence of ARGs on plasmids and chromosomes (Chromo.) among 1,817 Salmonella. Plasmids are represented in red, while chromosomes are represented in blue. (a) The left graph displays the average number of ARGs found on 1,999 plasmids and 1,817 chromosomes. The graph on the right side illustrates the average number of ARGs per 10 kb base length of both plasmids and chromosomes. (b) Diversity of ARG category carried by chromosomes and plasmids. (c) Principal component analysis (PCA) of ARG types and their abundances on chromosomes and plasmids. (d) Specific differences in the categories of ARGs carried by chromosomes and plasmids. On the graph, the vertical axis represents distinct ARG categories, while the horizontal axis denotes the count of distinct ARG classes in each respective category. (e) Temporal dynamics of the average number of ARGs on plasmids and chromosomes.

