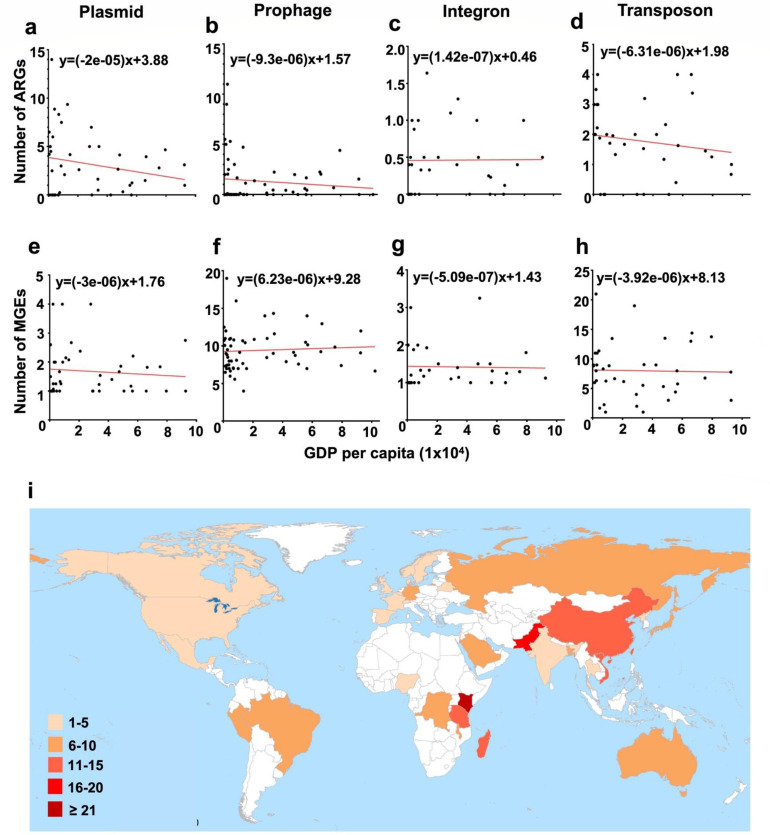
Fig 6.
An association analysis of MGE-carrying Salmonella with GDP per capita. A ranking in order of MGE type (plasmid, prophage, integron, and transposon). (a–d) Trend analysis of GDP per capita and the average number of MGEs carried by Salmonella. (e–h) Trend analysis of GDP per capita and the average number of ARGs carried by MGEs. (i) Average number of ARGs carried by MGEs in different countries.

