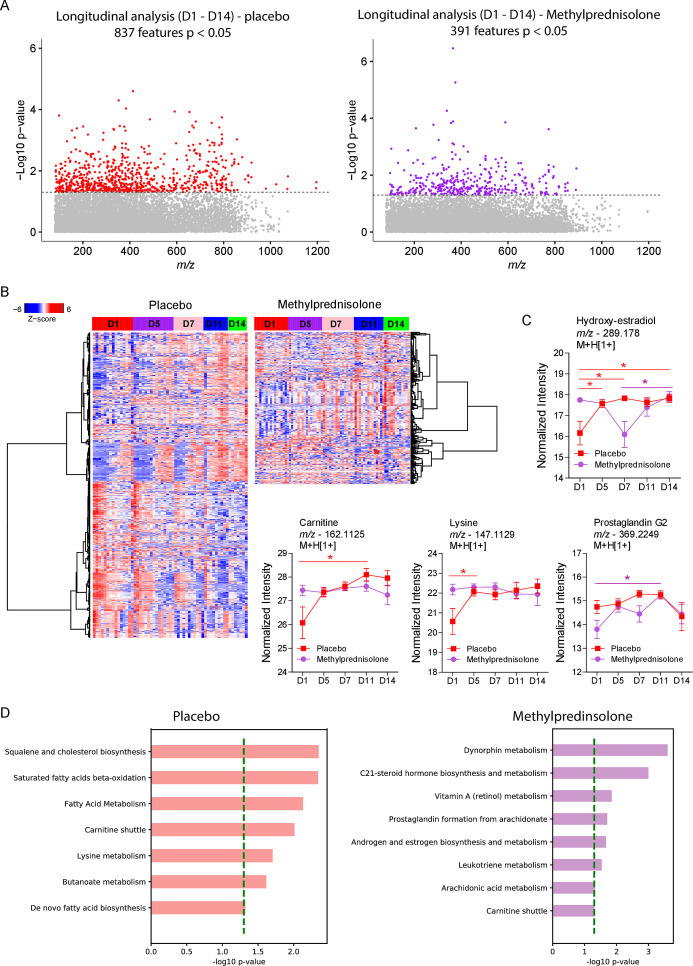
Fig 1.
Plasma metabolic signatures in the placebo and MP groups from D1 to D14. (A) Manhattan plot showing the distribution of significant metabolite features after a moderated F-test of metabolites in the patients’ plasma samples. The dashed line indicates P < 0.05. (B) Hierarchical clustering of identified significant metabolite features in the two patient groups. (C) Differential abundance analysis of significant metabolites common in the two treatment groups. (D) Mummichog pathway analysis of significant features per group. A multiple comparison test was used for between-day comparisons. *P < 0.05.

