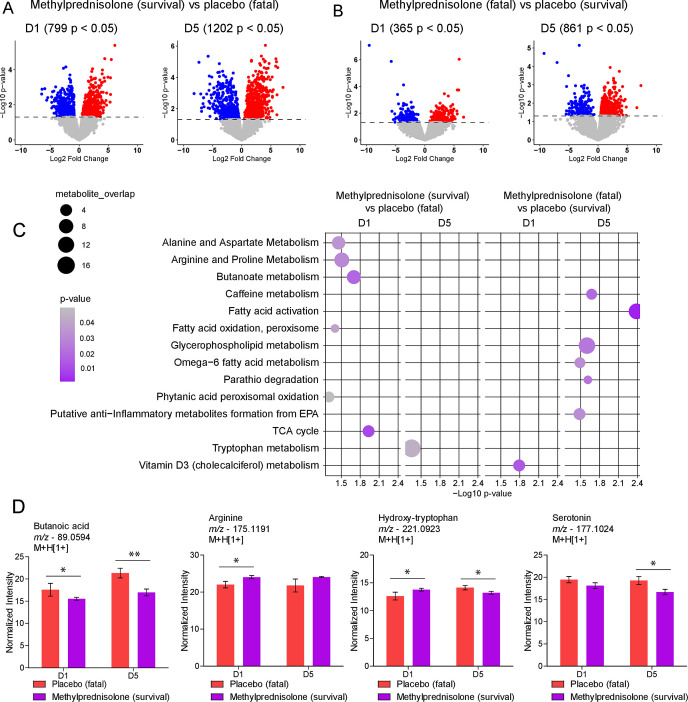
Fig 3.
Favorable or detrimental metabolic effects of MP treatment. (A and B) Volcano plots comparing two sets of patients at D1 and D5, demonstrating significantly different metabolite features differing of treated survivors and fatalities. The dashed line represents P < 0.05. The blue dots represent downregulated, while the red dots represent upregulated features in each comparison. (C) Mummichog pathway analysis of significant metabolite features on D1 and D5 for survivors and fatalities in the MP and placebo groups. Pathways that were significant for comparisons of survival and death in the same group of treatment were removed. (D) Differential abundance of annotated metabolites identified in treated individuals that survived compared to placebo who died. *P < 0.05, **P < 0.01.

