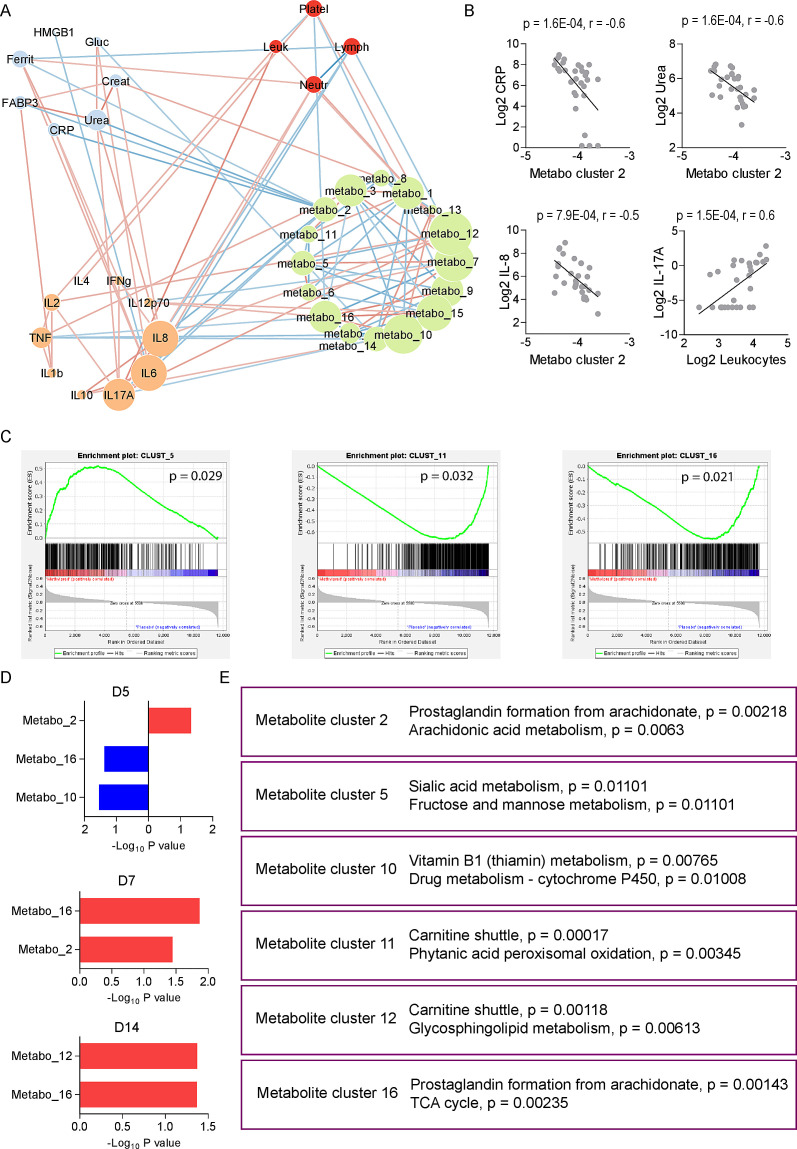
Fig 5.
Integrative network analysis of placebo and MP-treated COVID-19 patients. (A) Integrative network between laboratory parameters (biochemical and hematological), cytokines, and metabolite clusters on D1. The red lines indicate positive associations and the blue lines represent negative associations. (B) Examples of the most significant correlations found in the integrative network. (C) Cluster enrichment analysis comparing methylprednisolone versus placebo at D1. (D) Cluster enrichment analysis comparing methylprednisolone versus placebo at D5, D7, and D14. (E) Pathway enrichment analysis of significant clusters in items (C) and (D).

