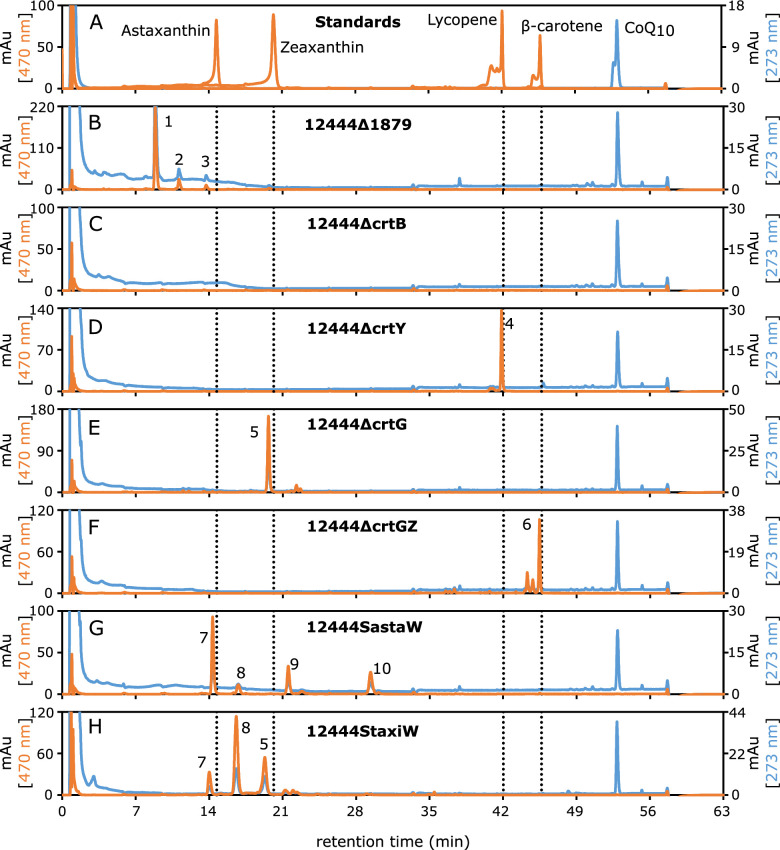
Fig 2.
High-performance liquid chromatography (HPLC) analyses of acetone:methanol extracts of representative N. aromaticivorans cultures. Absorbances are shown for 273 nm (the wavelength of maximum absorbance for CoQ10; blue line) and 470 nm (a wavelength where all carotenoids investigated have some absorbance; orange line). Standard compounds (A) analyzed are astaxanthin, zeaxanthin, β-carotene, lycopene, and CoQ10; vertical dotted lines in panels B–H show the time of maximum absorbance for the carotenoid standards. The strains analyzed are 12444Δ1879 (B), 12444ΔcrtB (C), 12444ΔcrtY (D), 12444ΔcrtG (E), 12444ΔcrtGZ (F), 12444SastaW (G), and 12444StaxiW (H). Data are shown as milliabsorbance units (mAu). Major carotenoid peaks are numbered from 1 to 13. Absorbance spectra for all major peaks are shown in Fig. S1 to S8.

