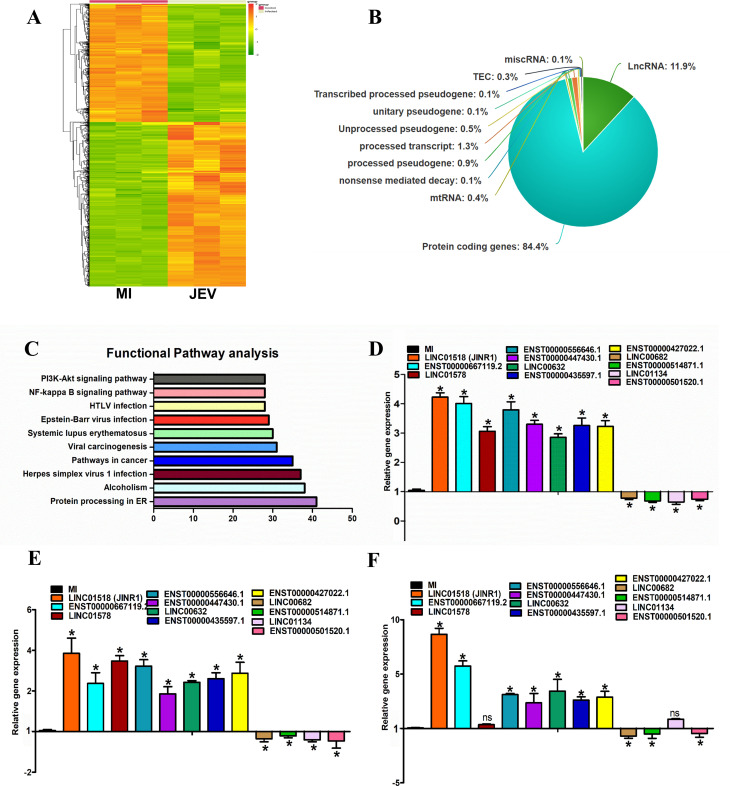
Fig 1.
Identification of JEV-regulated lncRNAs in human neuronal cell line. (A) Heat map of DEG in SH-SY5Y cells 48 h after mock or JEV Infection (n = 3; DEGs ≥ 1.5-fold, P < 0.05). (B) Pie chart representing the class of DEGs (P < 0.05) identified from the whole transcriptome sequencing in SH-SY5Y cells at 48 hpi. (C) Pathway analysis of DEGs using Kyoto Encyclopedia of Genes and Genomes. The vertical axis shows the pathways in descending order by the deregulated genes, and the horizontal axis represents the fold enrichment. (D) Validation of JEV-regulated significant DE lncRNAs identified from whole transcriptome sequencing using quantitative real-time PCR (qRT-PCR) in SH-SY5Y cells. RNA samples were analyzed by qRT-PCR, and error bars represent the mean ± SEM from three independent experiments. *Significant change compared to MI. Statistical comparisons were made using Student’s t-test. (E) Expression of DE lncRNAs during DENV infection using qRT-PCR in SH-SY5Y cells. RNA samples were analyzed by qRT-PCR, and error bars represent the mean ± SEM from three independent experiments. *Significant change compared to MI. Statistical comparisons were made using Student’s t-test. (F) Expression of DE lncRNAs during WNV infection using qRT-PCR in SH-SY5Y cells. RNA samples were analyzed by qRT-PCR, and error bars represent the mean ± SEM from three independent experiments. *Significant change compared to MI. Statistical comparisons were made using Student’s t-test.

