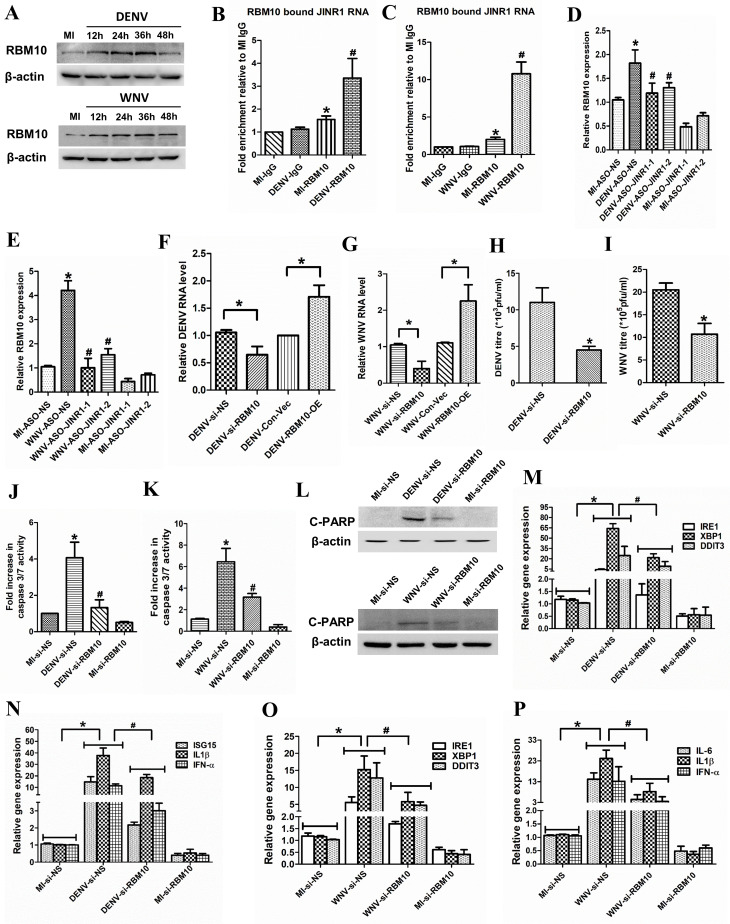
Fig 6.
JINR1 associates with RBM10 and also regulates its expression to regulate DENV and WNV viral replication, cell death, and gene expression. (A) DENV or WNV infection increases RBM10 protein levels. SH-SY5Y cells were infected with DENV or WNV (MOI 5) for the indicated time, and cell lysates were subjected to Western blot analysis. (B) JINR1 interacts with RBM10 during DENV infection. JINR1 RNA levels in RBM10 immunoprecipitated from lysates of formaldehyde-crosslinked DENV or MI SH-SY5Y cells were measured by qRT-PCR analysis, normalized to input, and represented as fold enrichment relative to MI-IgG IP. Values represent mean ± SEM from three independent experiments. *Significant change compared to MI-IgG IP (P < 0.05). #Significant change compared to MI-RBM10 IP (P < 0.05). (C) JINR1 interacts with RBM10 during WNV infection. JINR1 RNA levels in RBM10 immunoprecipitated from the lysates of formaldehyde-crosslinked WNV or MI SH-SY5Y cells were measured by qRT-PCR analysis, normalized to input, and represented as fold enrichment relative to MI-IgG IP. Values represent mean ± SEM from three independent experiments. *Significant change compared to MI-IgG IP (P < 0.05). #Significant change compared to MI-RBM10 IP (P < 0.05). (D) JINR1 depletion attenuates DENV-induced RBM10. qRT-PCR analysis of RBM10 upon JINR1 depletion in SH-SY5Y cells at 36 hpi. (E) JINR1 depletion attenuates WNV-induced RBM10. qRT-PCR analysis of RBM10 upon JINR1 depletion in SH-SY5Y cells at 36 hpi. (F) RBM10 promotes DENV replication. SH-SY5Y cells were transfected with si-NS, si-RBM10, empty vector, or RBM10-OE, and viral replication was determined by quantifying the intracellular levels of DENV RNA using qRT-PCR at 36 hpi. (G) RBM10 promotes WNV replication. SH-SY5Y cells were transfected with si-NS, si-RBM10, empty vector, or RBM10-OE, and viral replication was determined by quantifying the intracellular levels of WNV RNA using qRT-PCR at 36 hpi. (H) RBM10 silencing reduces DENV titer. Quantification of viral titer upon RBM10 depletion during DENV infection is shown in Fig. S16A. (I) RBM10 silencing reduces WNV titer. Quantification of viral titer upon RBM10 depletion during WNV infection is shown in Fig. S16C. (J) RBM10 promotes apoptosis in DENV-infected SH-SY5Y cells. SH-SY5Y cells were transfected with si-NS or si-RBM10, and the caspase-3/7 activity was determined at 60 hpi. (K) RBM10 promotes apoptosis in WNV-infected SH-SY5Y cells. SH-SY5Y cells were transfected with si-NS or si-RBM10, and the caspase-3/7 activity was determined at 60 hpi. (L) RBM10 promotes cleaved PARP protein expression in DENV or WNV-infected SH-SY5Y cells. SH-SY5Y cells were transfected with si-NS or si-RBM10, and protein lysates were collected at 60 hpi. Cleaved PARP protein levels were analyzed by western blotting. (M) RBM10 depletion attenuates DENV-induced ER stress genes. qRT-PCR analysis of indicated ER stress genes upon RBM10 depletion in SH-SY5Y cells at 36 hpi. (N) RBM10 depletion reduces DENV-induced neuroinflammatory genes. qRT-PCR analysis of indicated neuroinflammatory genes upon RBM10 depletion in SH-SY5Y cells at 36 hpi. (O) RBM10 depletion attenuates WNV-induced ER stress genes. qRT-PCR analysis of indicated ER stress genes upon RBM10 depletion in SH-SY5Y cells at 36 hpi. (P) RBM10 depletion reduces WNV-induced neuroinflammatory genes. qRT-PCR analysis of indicated neuroinflammatory genes upon RBM10 depletion in SH-SY5Y cells at 36 hpi. Error bars represent the mean ± SEM from three independent experiments. Statistical comparison was made using the Student’s t-test. (B, D–G, and M–P) RNA samples were analyzed by qRT-PCR. (B and C) *Significant change compared to MI-IgG. #Significant change compared to MI-RBM10. (D and E) *Significant change compared to MI-ASO-NS. #Significant change compared to DENV-ASO-NS/WNV-ASO-NS. (F and G) *Significant change compared to DENV-si-NS/WNV-si-NS/DENV-Con-Vec/WNV-Con-Vec. (H and I) *Significant change compared to DENV-si-NS/WNV-si-NS. (J and K) *Significant change compared to MI-si-NS. #Significant change compared to DENV-si-NS/WNV-si-NS. (A and L) A representative blot is shown from three independent experiments with similar results. Blots were reprobed for β-actin to establish equal loading. (M–P) *Significant change compared to MI-si-NS. #Significant change compared to DENV-si-NS/WNV-si-NS.

