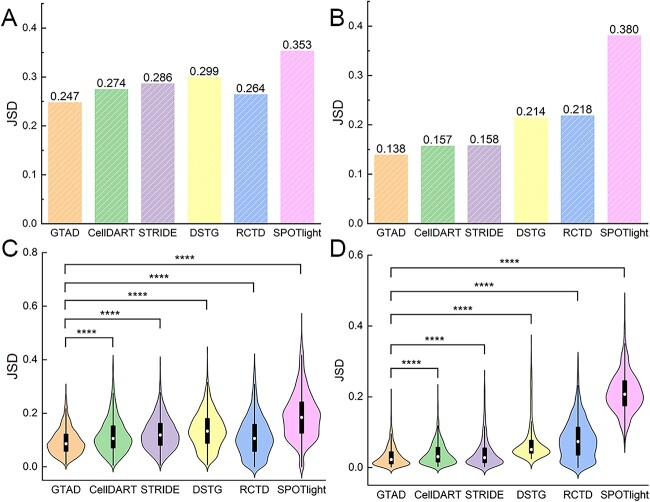
Figure 2.
Performance assessment of GTAD on benchmark datasets. (A) Assessment and comparative analysis of the performance of various methods on simulated spatial data generated from scRNA-seq data of human colorectal cancer. (B) Evaluation and comparison of the performance of different methods on simulated spatial data generated from scRNA-seq data of healthy mouse trachea. (C) Violin plots illustrating the comparative performance of various methods on the simulated dataset of human colorectal cancer. (D) Violin plots illustrating the comparative performance of different methods on the simulated dataset of healthy mouse trachea. In (A)–(D), the y-axis represents JSD (Jensen-Shannon Divergence) values. Wilcoxon Signed-Rank tests were conducted to compare JSD values between GTAD and other methods. Statistical significance (****P-value < 10–4) is indicated at the top of the violin plots in (C) – (D).

