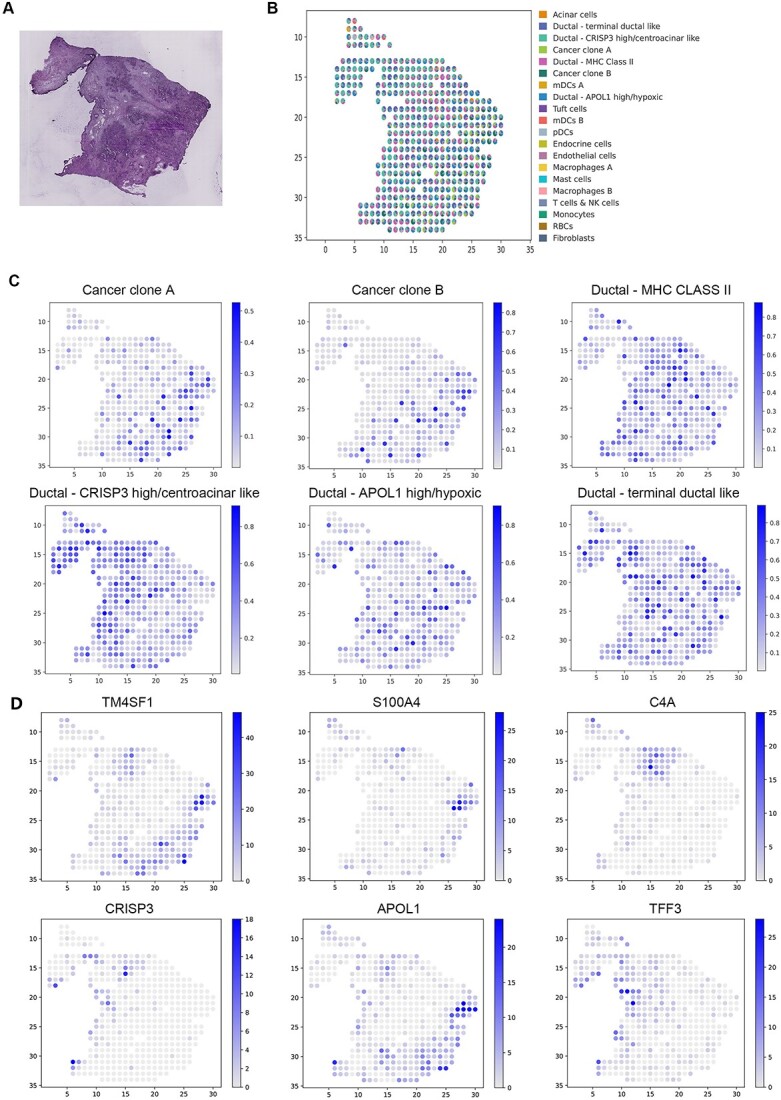
Figure 6.

Analysis of the PDAC SRT data. (A) H&E staining image of PDAC. (B) Visualization of the deconvolution results. Spatial scatter plots depict the predicted cell-type composition by GTAD, with each spot representing a spot in the SRT data. (C) Visualization of the abundance of selected cell types at each spatial location. (D) Expression levels of marker genes for the corresponding cell types in (D).
