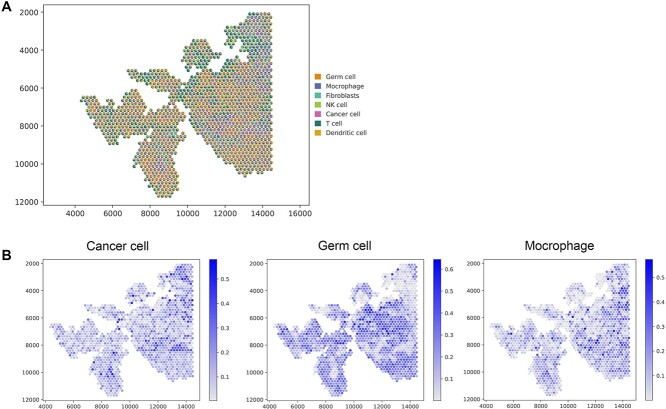
Figure 7.
Analysis of the human endometrial carcinoma data. (A) Visualization of the deconvolution results. Spatial scatter plots depict the predicted cell-type composition by GTAD, with each spot representing a spot in the SRT data. (B) Visualization of the abundance of selected cell types at each spatial location.

