Figure 2.
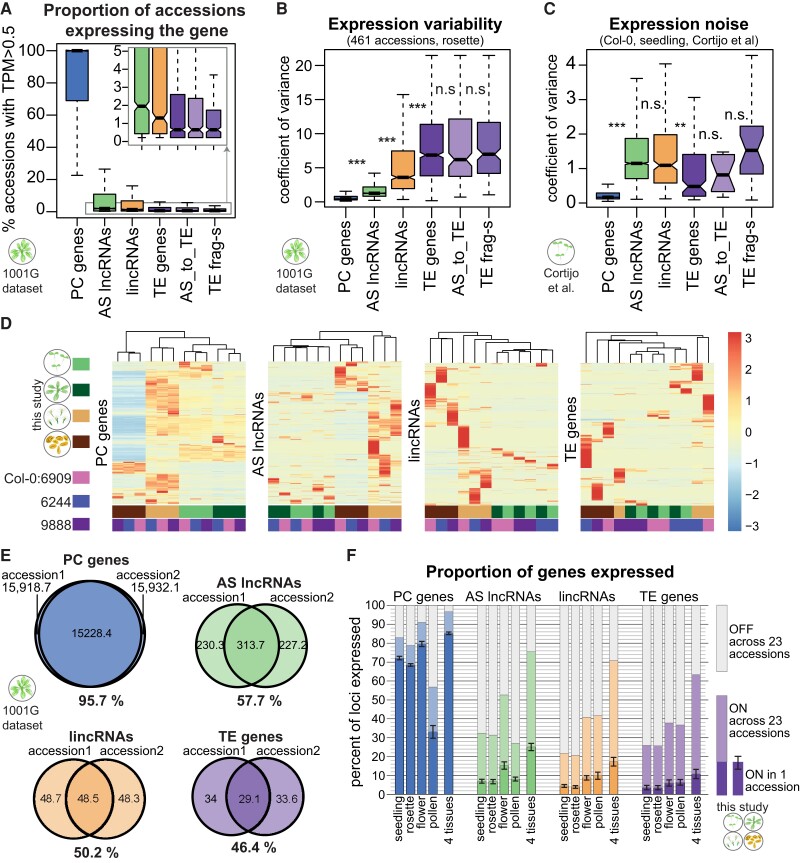
lncRNAs display extensive variability in their expression across accessions and appear to be largely silent. A) Proportion of accessions in the 1001 Genomes data set (Kawakatsu et al. 2016) where the indicated type of gene is expressed (TPM > 0.5). Only genes that are expressed in at least 1 accession are plotted. B) Coefficient of variance of expression in 461 accessions from the 1001 Genomes data set (Kawakatsu et al. 2016). Only genes with TPM > 1 in at least 1 accession are plotted. C) Expression noise, calculated from 14 technical replicates of Col-0 seedlings; expression noise values averaged across 12 samples are shown (Cortijo et al. 2019). Only genes with TPM > 1 in at least 1 sample are plotted. Boxplots: outliers are not shown, and P-values were calculated using a Mann–Whitney test on equalized sample sizes: ***P < 10–10, **P < 10–5, *P < 0.01, n.s. P > 0.01. D) Gene expression levels for different types of genes in 4 tissues for the reference accession Col-0 (accession number 6909) and 2 randomly picked accessions. Heatmaps were built using “pheatmap” in R with scaling by row. Only genes expressed in at least 1 sample are plotted. Clustering trees for rows not shown. E) Average number of genes expressed in an accession and its randomly selected partner accession from the 1001 Genomes data set and the number of genes expressed (TPM > 0.5) in both accessions. Percentages indicate the extent of overlap between accessions. F) Proportion of genes expressed in 1 accession in seedlings, 9-leaf rosettes, flowers, pollen, or all 4 tissues combined (lower part of the bars). The error bars show Sd across the 23 accessions. The light part of the bars indicates the additional proportion of genes that can be detected as expressed when all 23 accessions are considered.

