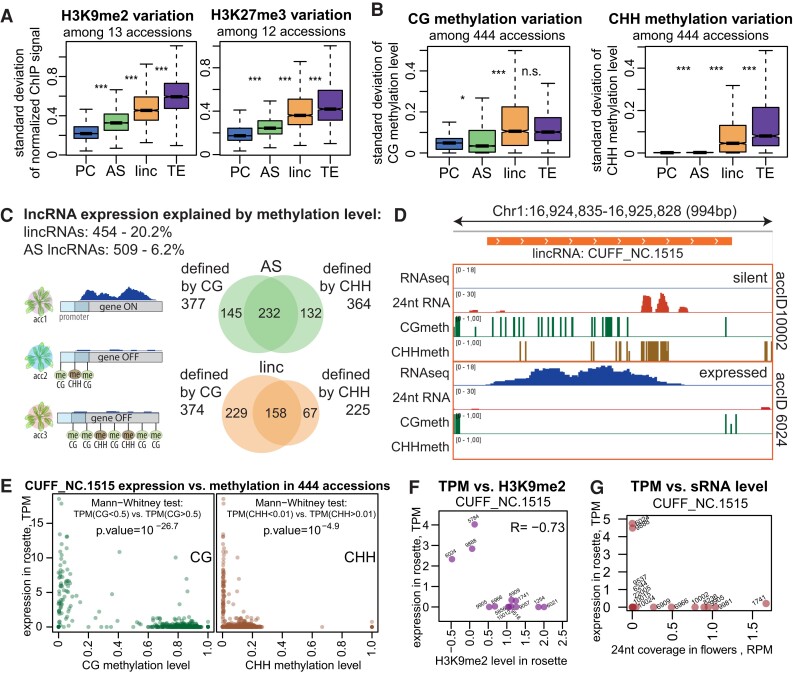
Figure 4.
lncRNAs display increased epigenetic variation that explains the variation in expression of many lncRNAs. A)Sd of input and quantile-normalized coverage (see Materials and methods) of H3K9me2 (left) and H3K27me3 (right) signals in rosettes across 13 or 12 accessions, respectively. B)Sd of CG (left) and CHH (right) methylation levels across 444 accessions (rosettes, 1001 Genomes data set (Kawakatsu et al. 2016)). P-values were calculated using Mann–Whitney test on equalized sample sizes: ***P < 10–10, **P < 10–5, *P < 0.01, n.s. P > 0.01. Outliers in the boxplots are not shown. C) Summary of lncRNAs for which expression can be explained by methylation (Supplemental Fig. S20B). The Venn diagrams show the overlap between loci for AS lncRNAs (green) and lincRNAs (orange) that were found to be defined by CG or CHH methylation levels. D) An example of a lincRNA defined by CG and CHH methylation, showing RNA-seq signal (forward strand), CG and CHH methylation levels in rosettes, and the 24-nt sRNA signal in flowers in 2 accessions. E) Expression level as a function of CG (left) or CHH (right) methylation for the example lincRNA across 444 accessions (Kawakatsu et al. 2016). The results of the Mann–Whitney tests used for defining the explanatory power of CG/CHH methylation are shown. F) Expression in rosettes as a function of H3K9me2 level in rosettes of the example lincRNA in 13 accessions. G) Expression in rosettes as a function of 24-nt sRNA coverage in flowers of the example lincRNA in 14 accessions.

