Figure 8.
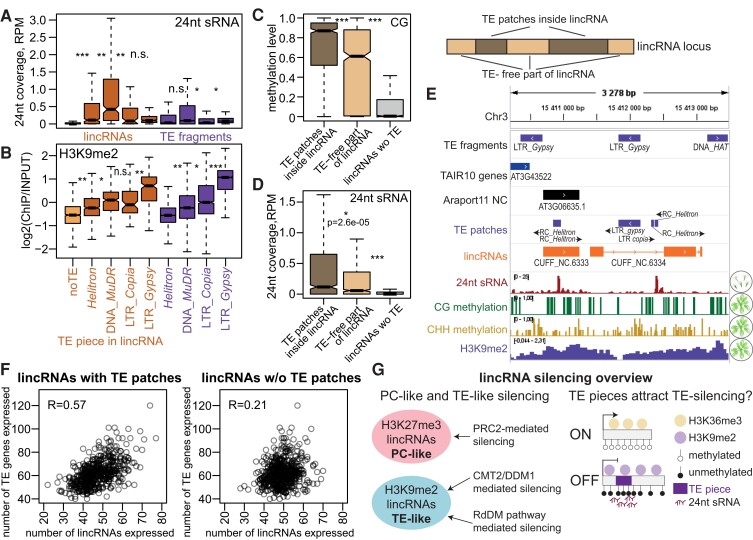
TE pieces appear to attract silencing to lincRNA loci. A) and B) 24-nt sRNA levels in Col-0 flowers (A) and H3K9me2 levels in rosettes (B) for lincRNAs with pieces of TEs from 4 superfamilies and TAIR10 TE fragments from the same superfamilies. Only lincRNAs with TE pieces from 1 superfamily are plotted. The light orange boxplot indicates lincRNAs without TE pieces (noTE). C) and D) Boxplots showing CG methylation level (C) and 24-nt sRNA coverage (D) for TE patches inside lincRNAs, TE patch–free parts of TE-containing lincRNA loci, and lincRNA loci without TE patches. Outliers not plotted. P-values were calculated using Mann–Whitney tests: ***P < 10–10, *P < 0.01. E) Integrative Genomics Viewer (IGV) screenshot showing an example of lincRNAs with TE patches that have higher levels of CG methylation and 24-nt sRNA coverage over TE patches than over the rest of the locus. F) Scatterplot showing the number of TE genes expressed in rosettes of 460 different accessions (Kawakatsu et al. 2016) as a function of the number of lincRNAs with TE pieces (left) and without TE pieces (right) expressed in the same accession. Pearson's correlation coefficient is displayed. G) Summary of lincRNA silencing pathways. PC-like lincRNAs that show H3K27me3 repressive histone marks are likely silenced by PRC2, while TE-like lincRNAs that display H3K9me2 are silenced by CMT2/DDM1 and RdDM pathways. TE piece presence likely attracts TE silencing and repressive chromatin to the lincRNA locus.

