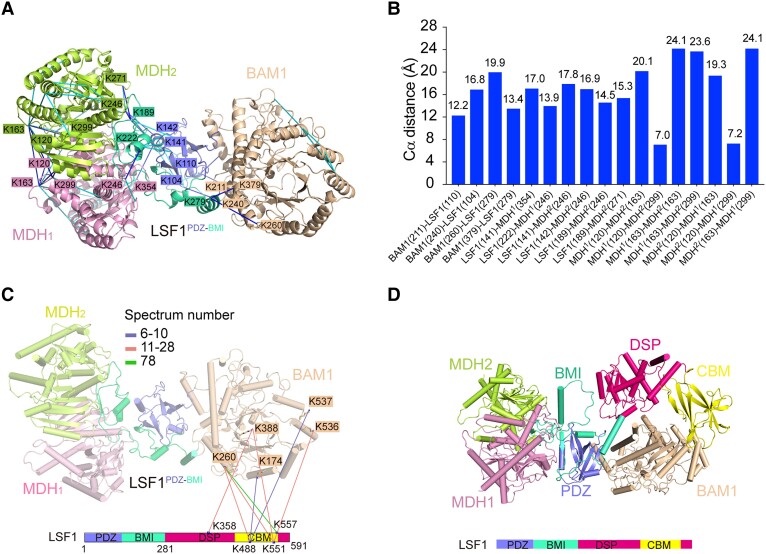
Figure 5.
Structural modeling of the complete BAM1–LSF1–MDH complex on the basis of CXMS data and AlphaFold2 prediction. A) Crosslinks mapped onto the structure of BAM1–LSF1–MDH complex. The blue and cyan lines indicate intersubunit and intrasubunit crosslinked residue pairs, respectively. For clarity, residues involved in the intersubunit interaction are shown, whereas those involved in the intrasubunit interaction are omitted. Residues are colored consistent with the corresponding subunits. B) The distance distribution of all crosslinked residue pairs mapped onto the structure of BAM1–LSF1–MDH complex. The 26 Å cutoff value was used to filter the crosslinks, well below the 35 Å upper limit. C) The intersubunit crosslinks between LSF1DSP-CBM and BAM1. The DSP and CBM domains of LSF1 are shown in hot pink, and yellow, respectively. The identified crosslink pairs are indicated by colored lines based on the spectrum number. For clarity, the LSF1PDZ-BMI-mediated crosslinked residue pairs are omitted. D) Structure model of the complete BAM1–LSF1–MDH complex based on CXMS data and AlphaFold2 predictions. BAM1, MDH1, and MDH2 are colored in beige, pink, and lemon, respectively. The LSF1 domains PDZ, BMI, DSP, and CBM are shown in slate, green-cyan, hot pink, and yellow, respectively. The DSP-CBM of LSF1 was docked in close proximity to BAM1 based on CXMS data.

