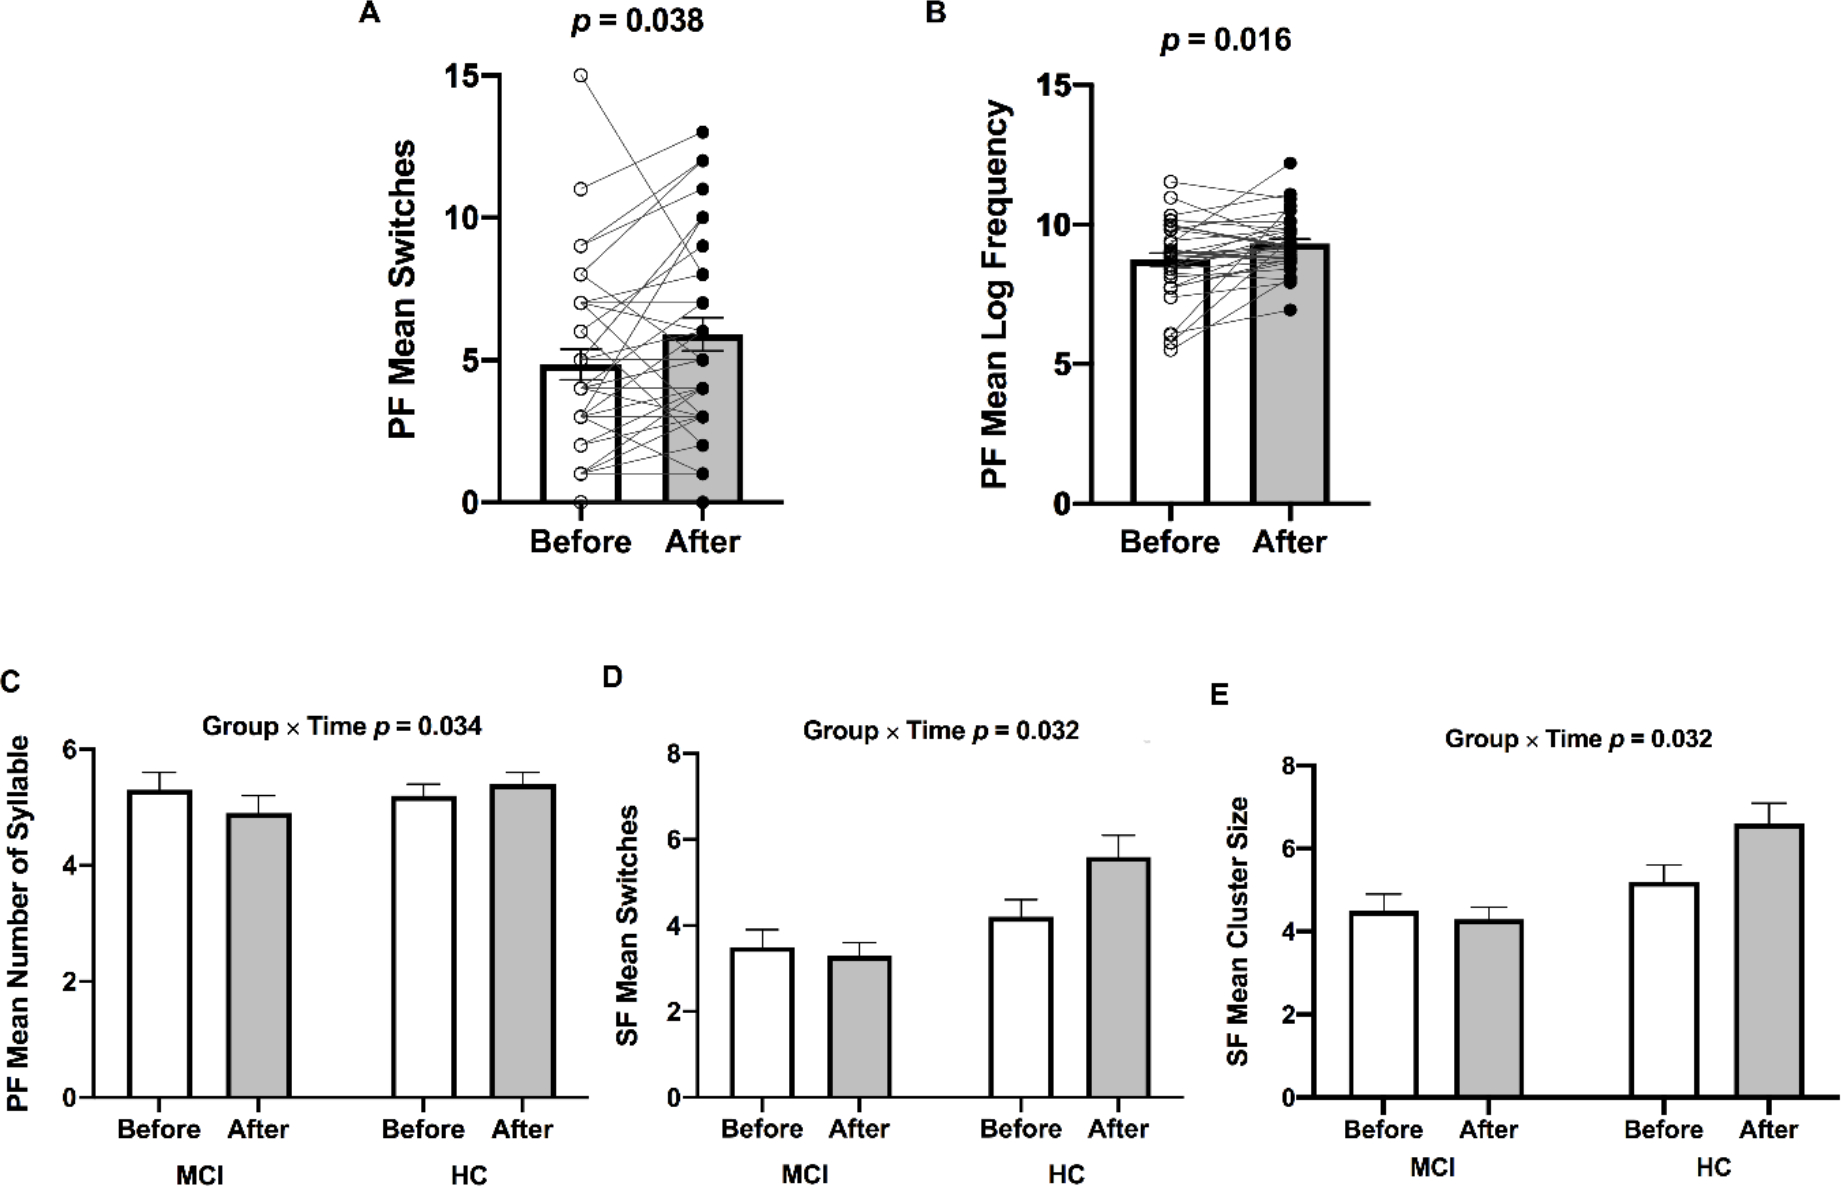
Fig 1.

Bar graphs (±SEM) illustrate increased (A) mean switches and (B) mean log frequency during the phonemic fluency task following ET in all participants (n = 35). Significant Group (HC vs MCI) × Time (before vs after ET) interactions were found in the (C) phonemic fluency mean number of syllables, (D) semantic fluency mean switches, and (E) semantic fluency cluster size. p-values above bar graphs indicate the effects of time (Panels A and B) and Group by Time interaction (Panels C, D, and E), respectively. Notes: PF, phonemic fluency task; SF, semantic fluency task.
